zerohertzLib.plot
Plot
다양한 변수들을 최대한 지정하지 않고 사용할 수 있는 시각화 함수들
- zerohertzLib.plot.barh(data, xlab=None, ylab=None, xlim=None, ylim=None, title='tmp', colors=None, figsize=(10, 15), rot=0, dim=None, dimsize=10, sign=1, dpi=300)[source]
Dictionary로 입력받은 data를 세로 bar chart로 시각화
- Parameters:
data¶ (
Dict[str, Any]) – 입력 dataxlab¶ (
Optional[str]) – Graph에 출력될 X축 labelylab¶ (
Optional[str]) – Graph에 출력될 Y축 labelxlim¶ (
Optional[List[Union[int, float]]]) – Graph에 출력될 X축 limitylim¶ (
Optional[List[Union[int, float]]]) – Graph에 출력될 Y축 limittitle¶ (
Optional[str]) – Graph에 표시될 제목 및 file 이름colors¶ (
Optional[Union[str, List]]) – 각 요소의 색figsize¶ (
Optional[Tuple[int]]) – Graph의 가로, 세로 길이rot¶ (
Optional[int]) – X축의 눈금 회전 각도dim¶ (
Optional[str]) – 각 bar 상단에 표시될 값의 단위 (%: percentage)dimsize¶ (
Optional[float]) – 각 bar 상단에 표시될 값의 크기sign¶ (
Optional[int]) – 각 bar 상단에 표시될 값의 유효숫자dpi¶ (
Optional[int]) – Graph 저장 시 DPI (Dots Per Inch)
- Returns:
저장된 graph의 절대 경로
- Return type:
str
Examples
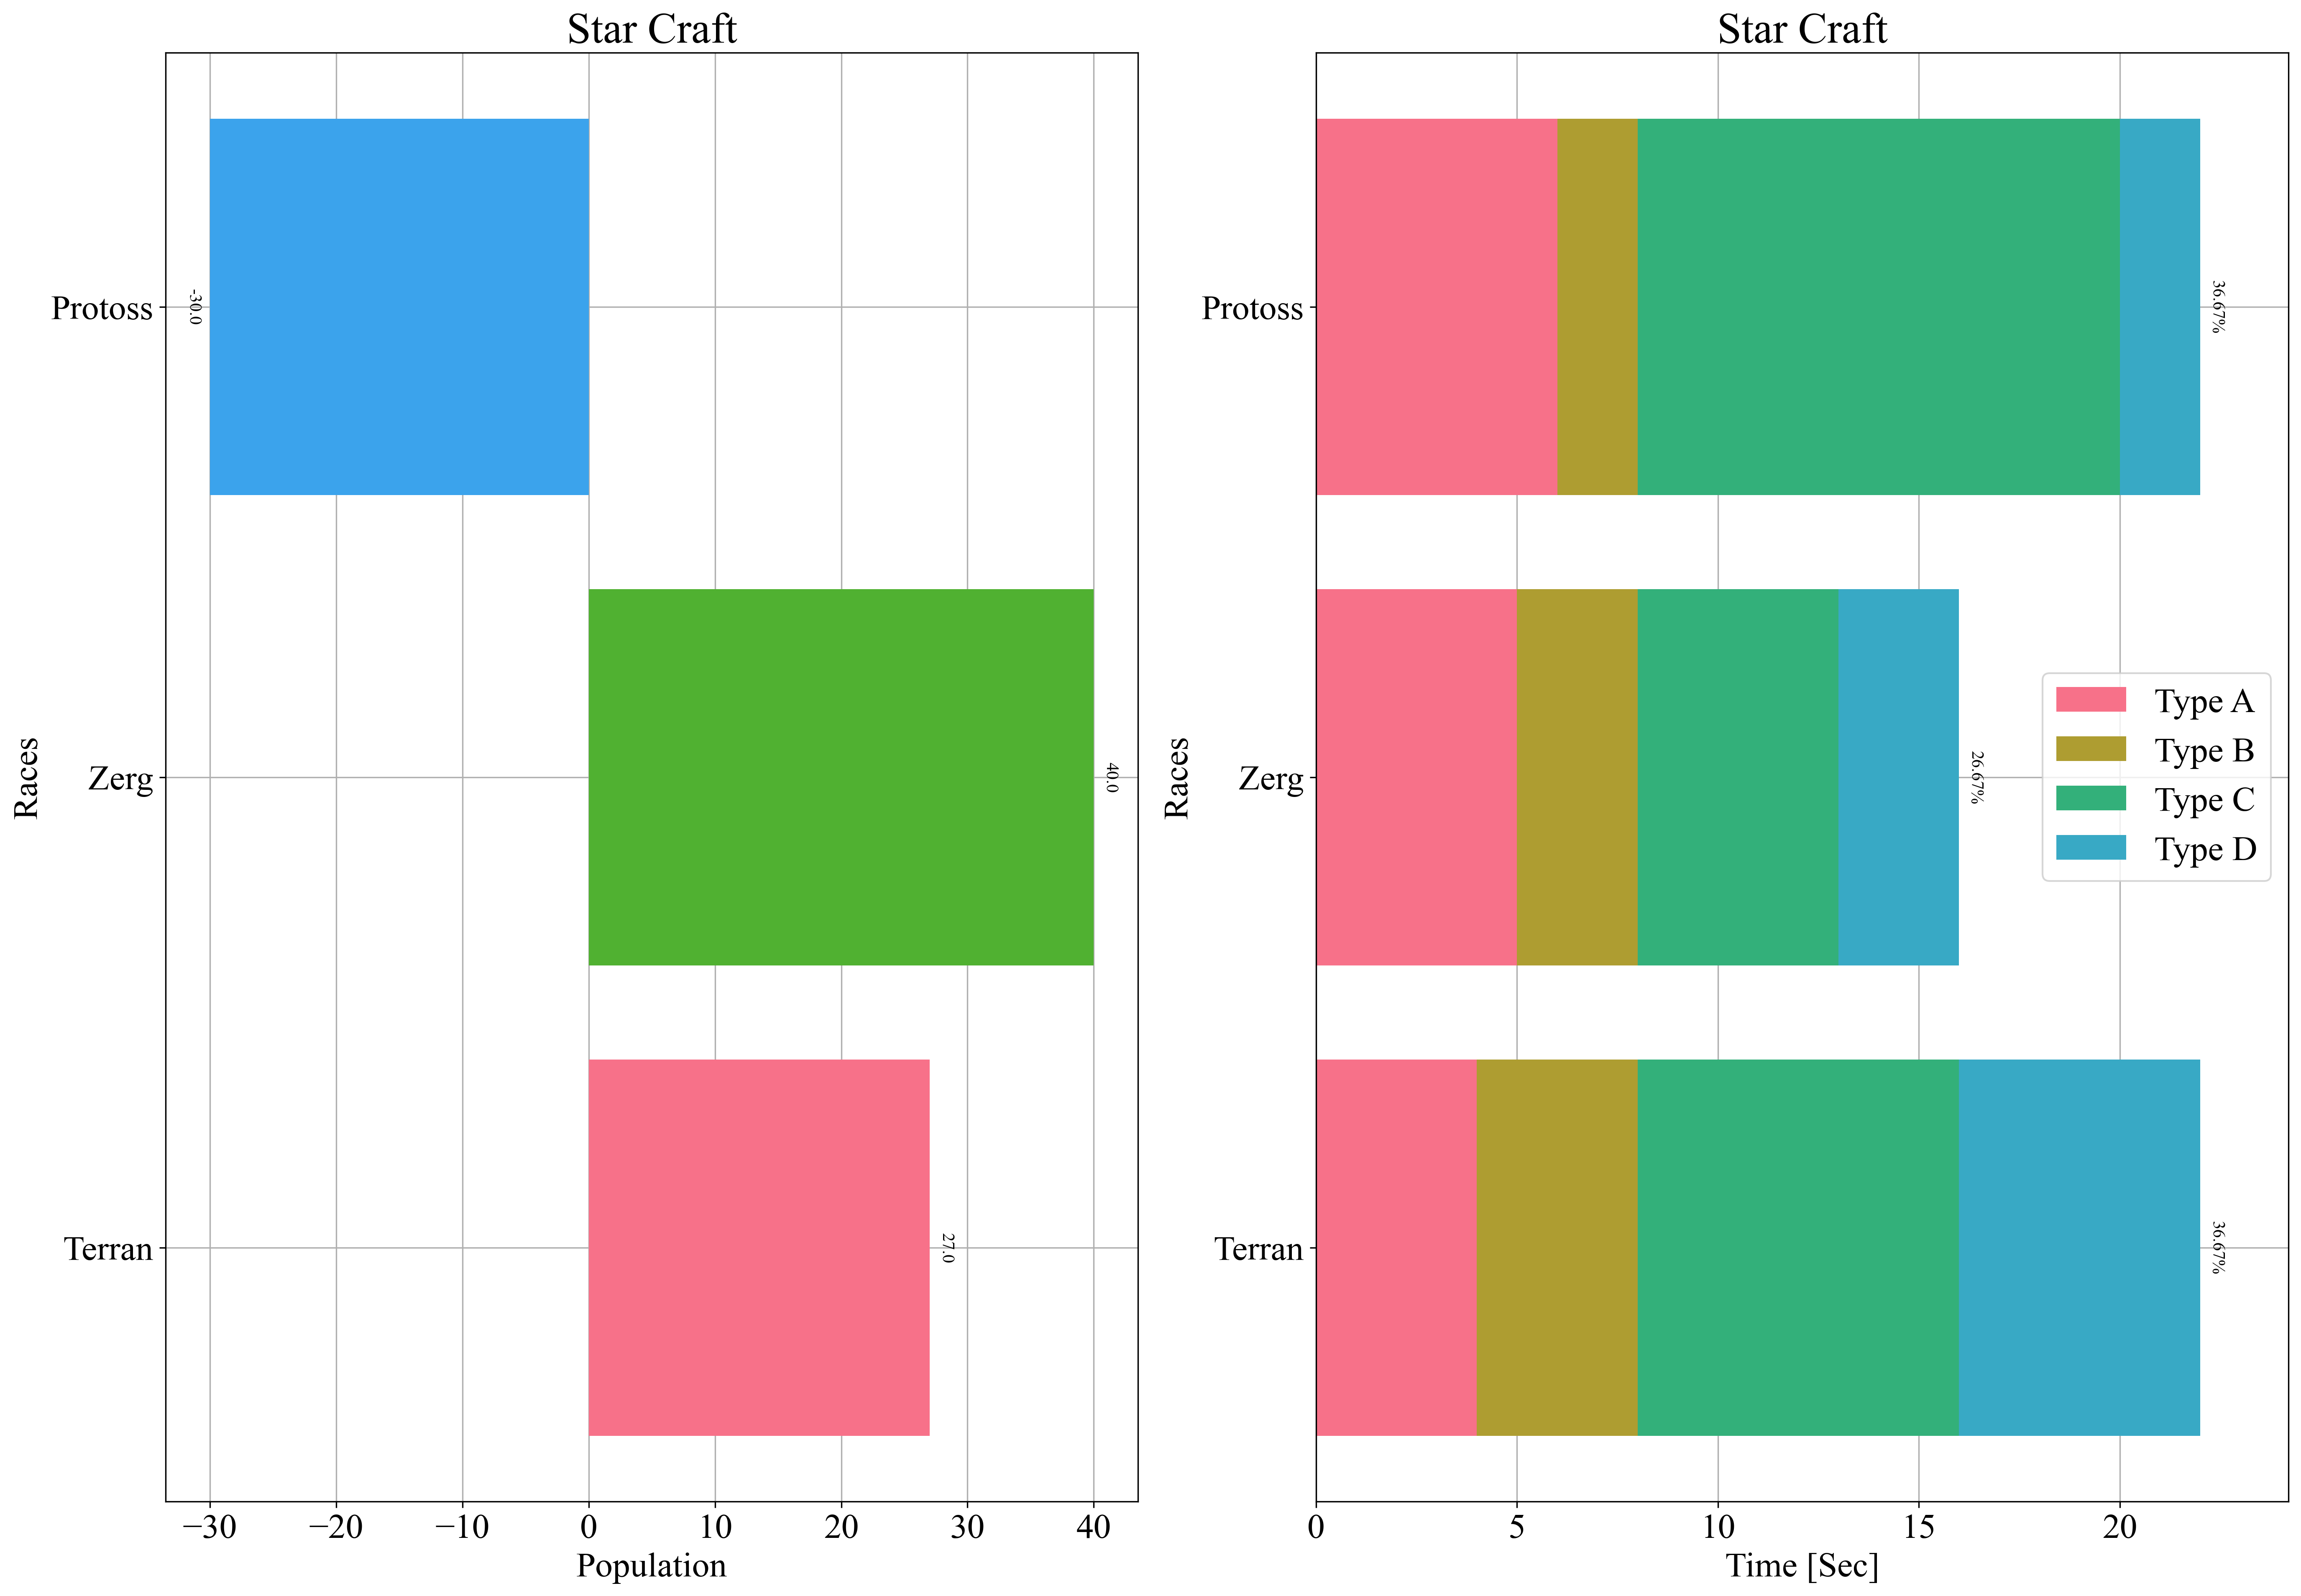
>>> data = {"Terran": 27, "Zerg": 40, "Protoss": -30}
>>> zz.plot.barh(data, xlab="Population", ylab="Races", title="Star Craft", dim="")
>>> data = {"yticks": ["Terran", "Zerg", "Protoss"], "Type A": [4, 5, 6], "Type B": [4, 3, 2], "Type C": [8, 5, 12], "Type D": [6, 3, 2]}
>>> zz.plot.barh(data, xlab="Time [Sec]", ylab="Races", title="Star Craft", dim="%", sign=2)
- zerohertzLib.plot.barv(data, xlab=None, ylab=None, xlim=None, ylim=None, title='tmp', colors=None, figsize=(15, 10), rot=0, dim=None, dimsize=10, sign=1, dpi=300)[source]
Dictionary로 입력받은 data를 가로 bar chart로 시각화
- Parameters:
data¶ (
Dict[str, Any]) – 입력 dataxlab¶ (
Optional[str]) – Graph에 출력될 X축 labelylab¶ (
Optional[str]) – Graph에 출력될 Y축 labelxlim¶ (
Optional[List[Union[int, float]]]) – Graph에 출력될 X축 limitylim¶ (
Optional[List[Union[int, float]]]) – Graph에 출력될 Y축 limittitle¶ (
Optional[str]) – Graph에 표시될 제목 및 file 이름colors¶ (
Optional[Union[str, List]]) – 각 요소의 색figsize¶ (
Optional[Tuple[int]]) – Graph의 가로, 세로 길이rot¶ (
Optional[int]) – X축의 눈금 회전 각도dim¶ (
Optional[str]) – 각 bar 상단에 표시될 값의 단위 (%: percentage)dimsize¶ (
Optional[float]) – 각 bar 상단에 표시될 값의 크기sign¶ (
Optional[int]) – 각 bar 상단에 표시될 값의 유효숫자dpi¶ (
Optional[int]) – Graph 저장 시 DPI (Dots Per Inch)
- Returns:
저장된 graph의 절대 경로
- Return type:
str
Examples
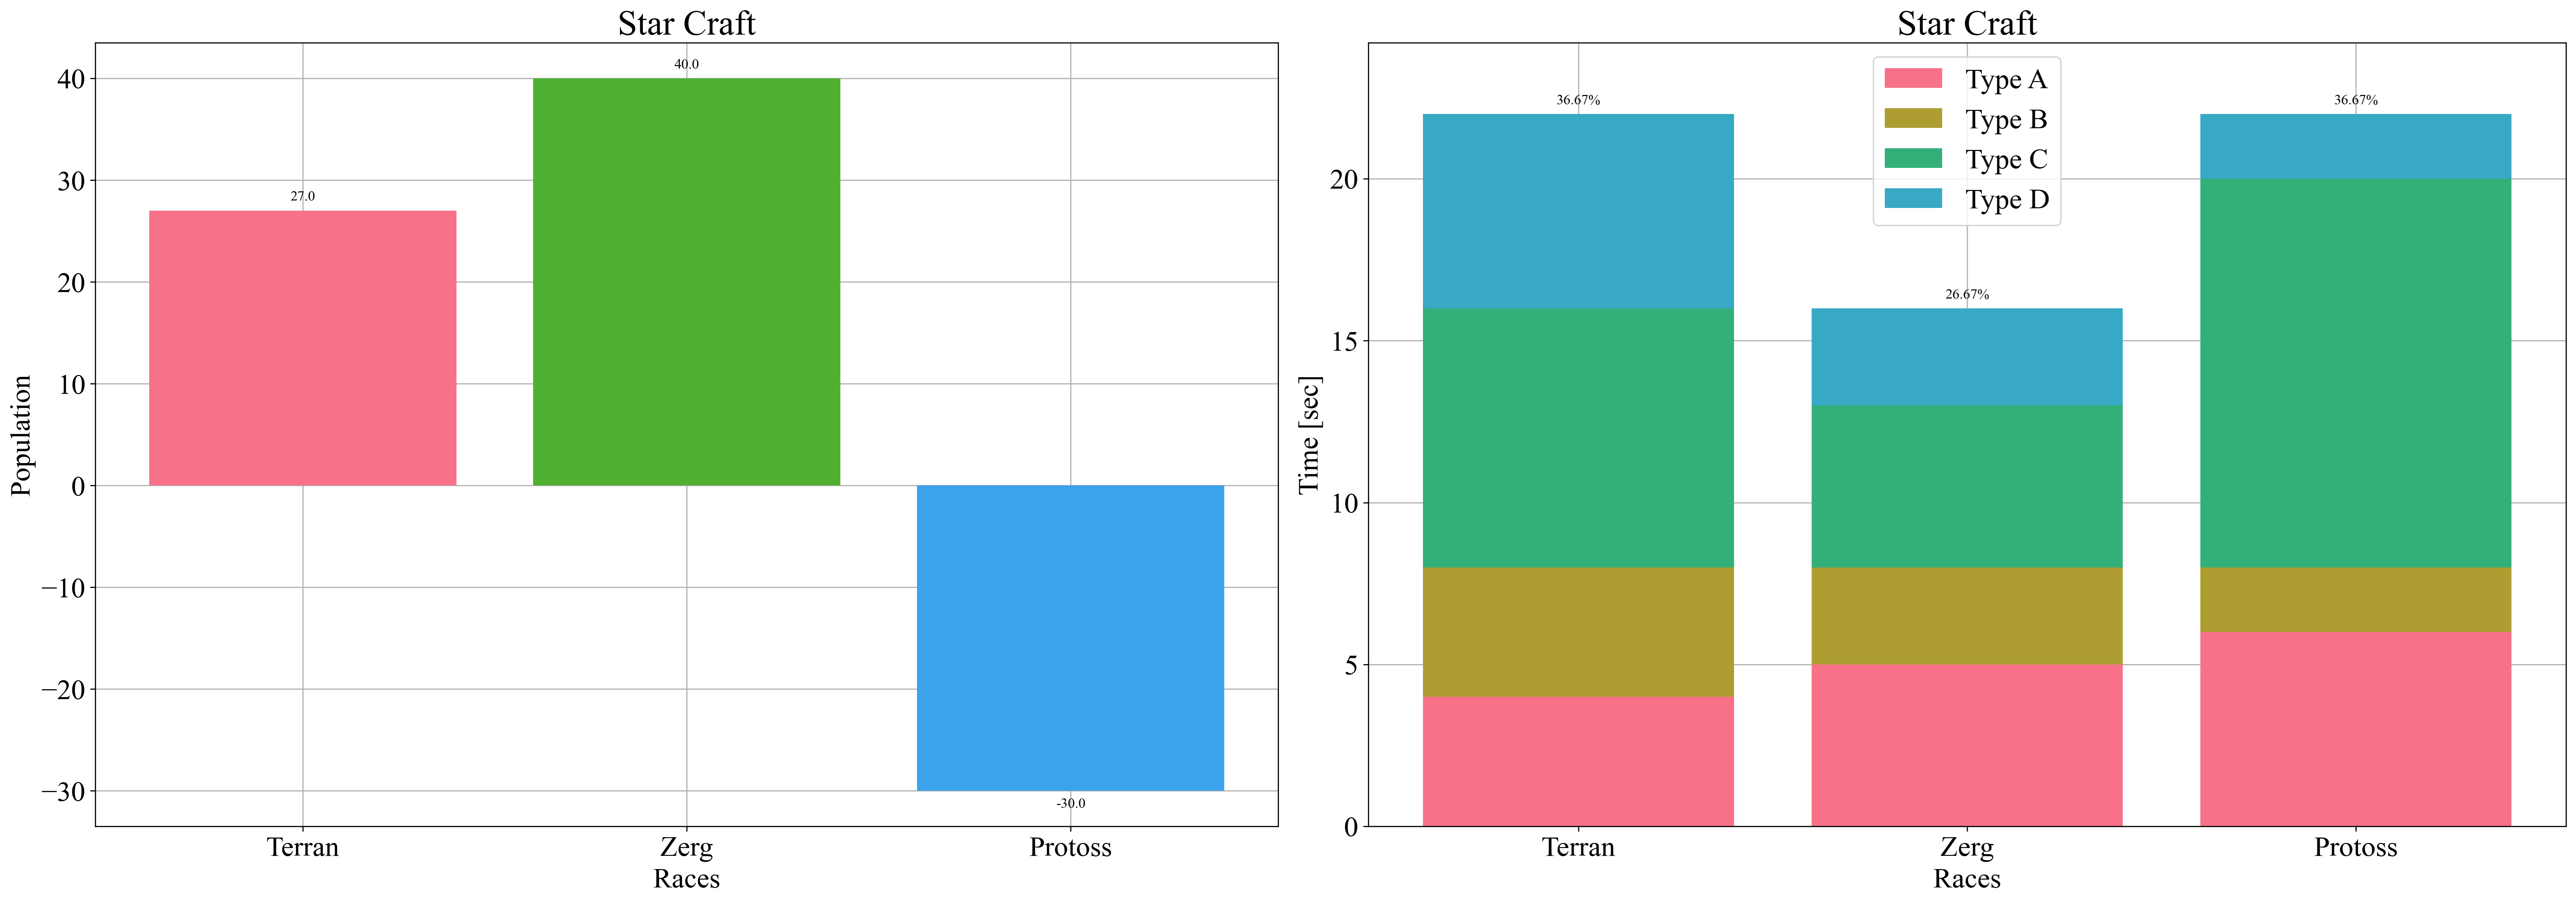
>>> data = {"Terran": 27, "Zerg": 40, "Protoss": -30}
>>> zz.plot.barv(data, xlab="Races", ylab="Population", title="Star Craft", dim="")
>>> data = {"xticks": ["Terran", "Zerg", "Protoss"], "Type A": [4, 5, 6], "Type B": [4, 3, 2], "Type C": [8, 5, 12], "Type D": [6, 3, 2]}
>>> zz.plot.barv(data, xlab="Races", ylab="Time [sec]", title="Star Craft", dim="%", sign=2)
- zerohertzLib.plot.candle(data, title='tmp', figsize=(18, 10), signals=None, threshold=1, dpi=300)[source]
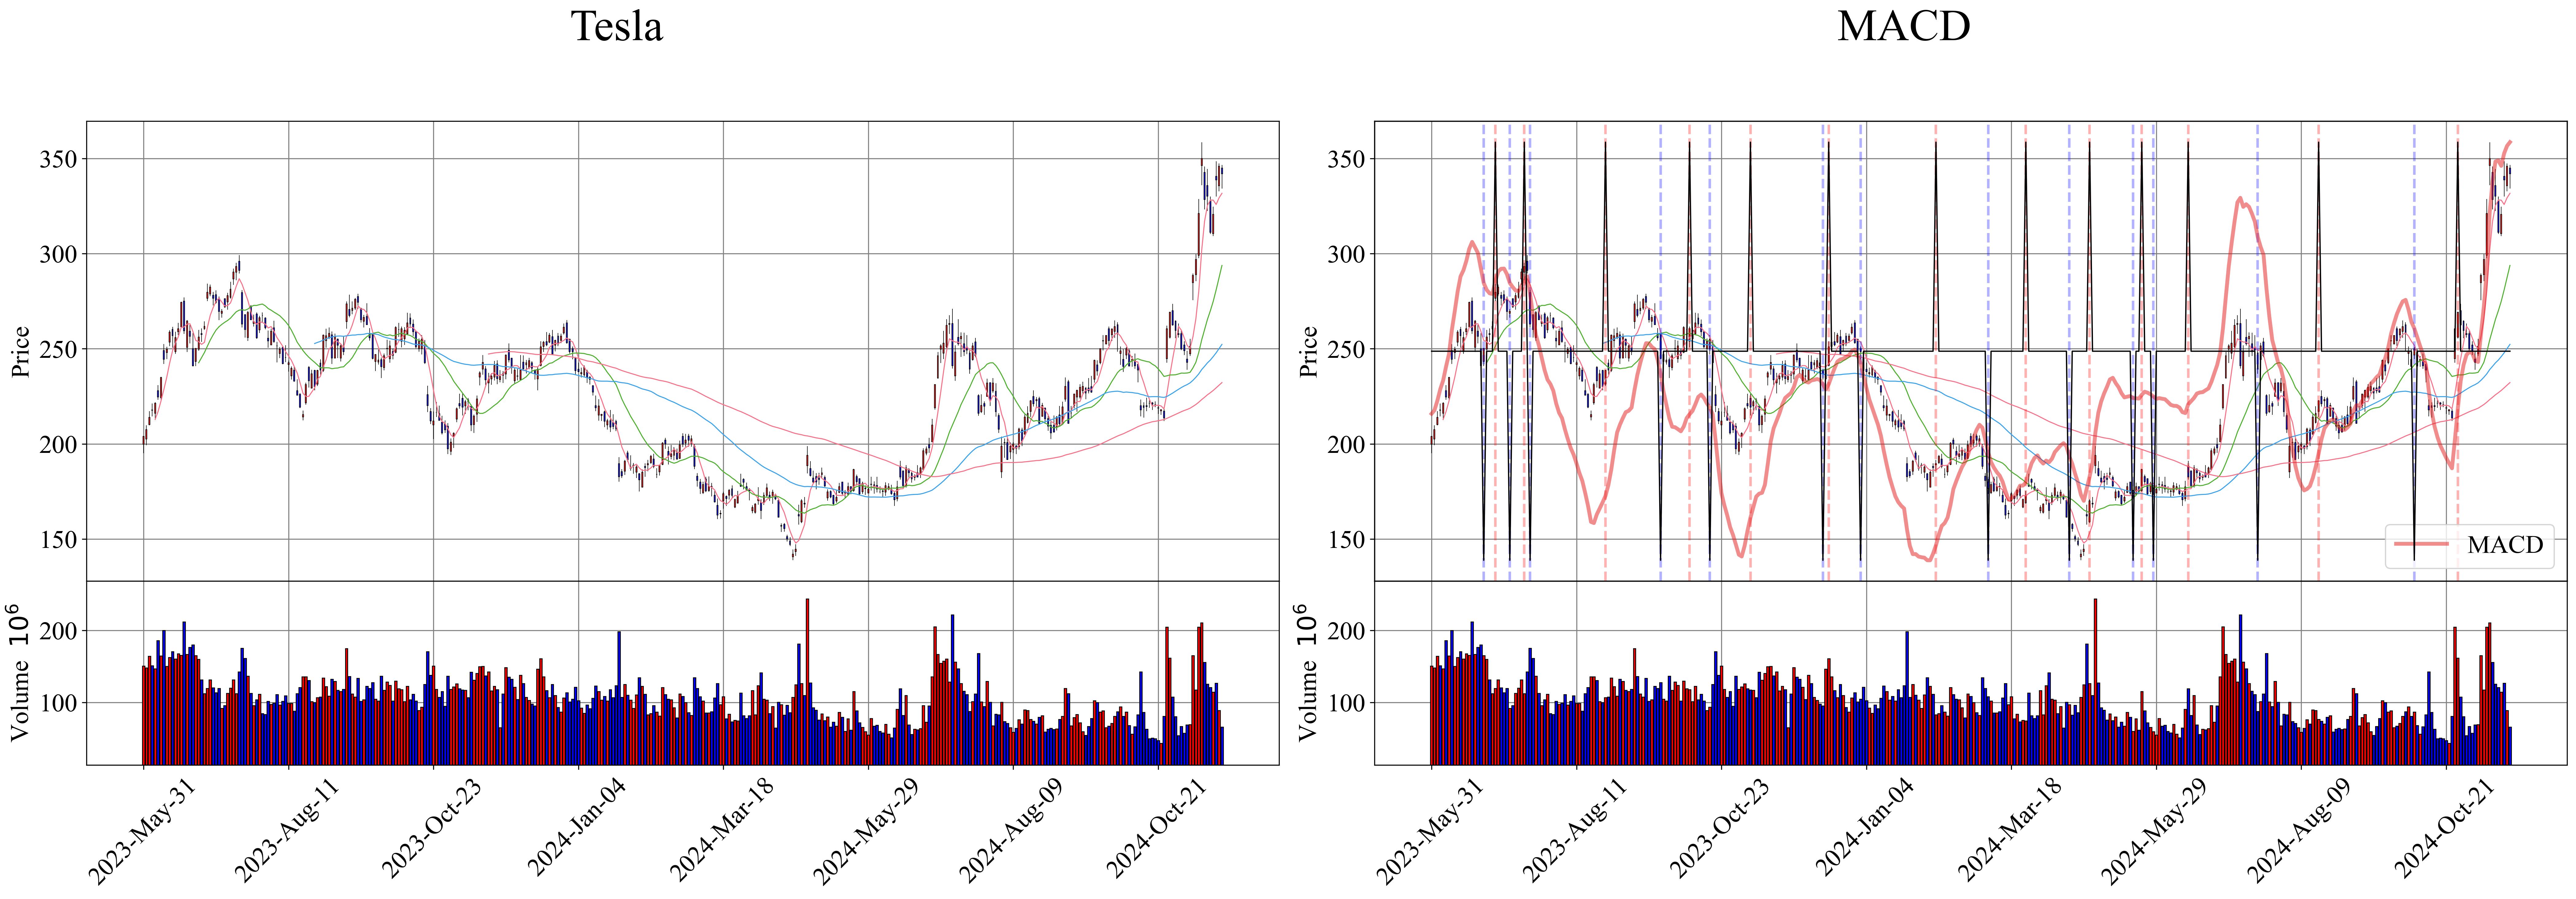
OHLCV (Open, High, Low, Close, Volume) data에 따른 candle chart
Note
적색: 매수
청색: 매도
실선 (
-): Backtest 시 signal이 존재하는 매수, 매도파선 (
--): Backtest 시 사용하지 않은 signal의 매수, 매도일점쇄선 (
-.): Backtest logic에 의한 매수, 매도
- Parameters:
data¶ (
pd.DataFrame) – OHLCV (Open, High, Low, Close, Volume) datatitle¶ (
Optional[str]) – Graph에 표시될 제목 및 file 이름figsize¶ (
Optional[Tuple[int]]) – Graph의 가로, 세로 길이signals¶ (
Optional[Dict[str, Any]]) – 추가적으로 plot할 datathreshold¶ (
Optional[Union[int, Tuple[int]]]) – 매수, 매도를 결정할signals경계값dpi¶ (
Optional[int]) – Graph 저장 시 DPI (Dots Per Inch)
- Returns:
저장된 graph의 절대 경로
- Return type:
str
Examples
>>> zz.plot.candle(data, title)
>>> signals = zz.quant.macd(data)
>>> zz.plot.candle(data, "MACD", signals=signals)
- zerohertzLib.plot.color(cnt=1, rand=False, uint8=False, palette='husl')[source]
색 추출 함수
- Parameters:
- Returns:
단일 색 또는 list로 구성된 여러 색
- Return type:
Union[Tuple[float], List[int], List[Tuple[float]], List[List[int]]]
Examples
>>> zz.plot.color()
(0.9710194877714075, 0.4645444048369612, 0.21958695134807432)
>>> zz.plot.color(4)
[(0.9677975592919913, 0.44127456009157356, 0.5358103155058701), (0.5920891529639701, 0.6418467016378244, 0.1935069134991043), (0.21044753832183283, 0.6773105080456748, 0.6433941168468681), (0.6423044349219739, 0.5497680051256467, 0.9582651433656727)]
>>> zz.plot.color(4, True)
[(0.22420518847992715, 0.6551391052055489, 0.8272616286387289), (0.9677975592919913, 0.44127456009157356, 0.5358103155058701), (0.21125140522513897, 0.6760830215342485, 0.6556099802889619), (0.9590000285927794, 0.36894286394742526, 0.9138608732554839)]
>>> zz.plot.color(uint8=True)
[53, 172, 167]
>>> zz.plot.color(4, uint8=True)
[[246, 112, 136], [150, 163, 49], [53, 172, 164], [163, 140, 244]]
>>> zz.plot.color(4, True, True)
[[247, 117, 79], [73, 160, 244], [54, 171, 176], [110, 172, 49]]
- zerohertzLib.plot.figure(figsize=(15, 10))[source]
Graph 생성을 위한 함수
- Parameters:
figsize¶ (
Optional[Tuple[int]]) – Graph의 가로, 세로 길이- Returns:
Graph window 생성
- Return type:
matplotlib.figure.Figure
Examples
>>> zz.plot.figure()
<Figure size 1500x1000 with 0 Axes>
>>> zz.plot.figure((20, 20))
<Figure size 2000x2000 with 0 Axes>
- zerohertzLib.plot.hist(data, xlab=None, ylab=None, xlim=None, ylim=None, title='tmp', colors=None, cnt=30, ovp=True, figsize=(15, 10), dpi=300)[source]
Dictionary로 입력받은 data를 histogram으로 시각화
- Parameters:
data¶ (
Dict[str, List[Union[int, float]]]) – 입력 dataxlab¶ (
Optional[str]) – Graph에 출력될 X축 labelylab¶ (
Optional[str]) – Graph에 출력될 Y축 labelxlim¶ (
Optional[List[Union[int, float]]]) – Graph에 출력될 X축 limitylim¶ (
Optional[List[Union[int, float]]]) – Graph에 출력될 Y축 limittitle¶ (
Optional[str]) – Graph에 표시될 제목 및 file 이름colors¶ (
Optional[Union[str, List]]) – 각 요소의 색cnt¶ (
Optional[int]) – Bin의 개수ovp¶ (
Optional[bool]) – Class에 따른 histogram overlap 여부figsize¶ (
Optional[Tuple[int]]) – Graph의 가로, 세로 길이dpi¶ (
Optional[int]) – Graph 저장 시 DPI (Dots Per Inch)
- Returns:
저장된 graph의 절대 경로
- Return type:
str
Examples
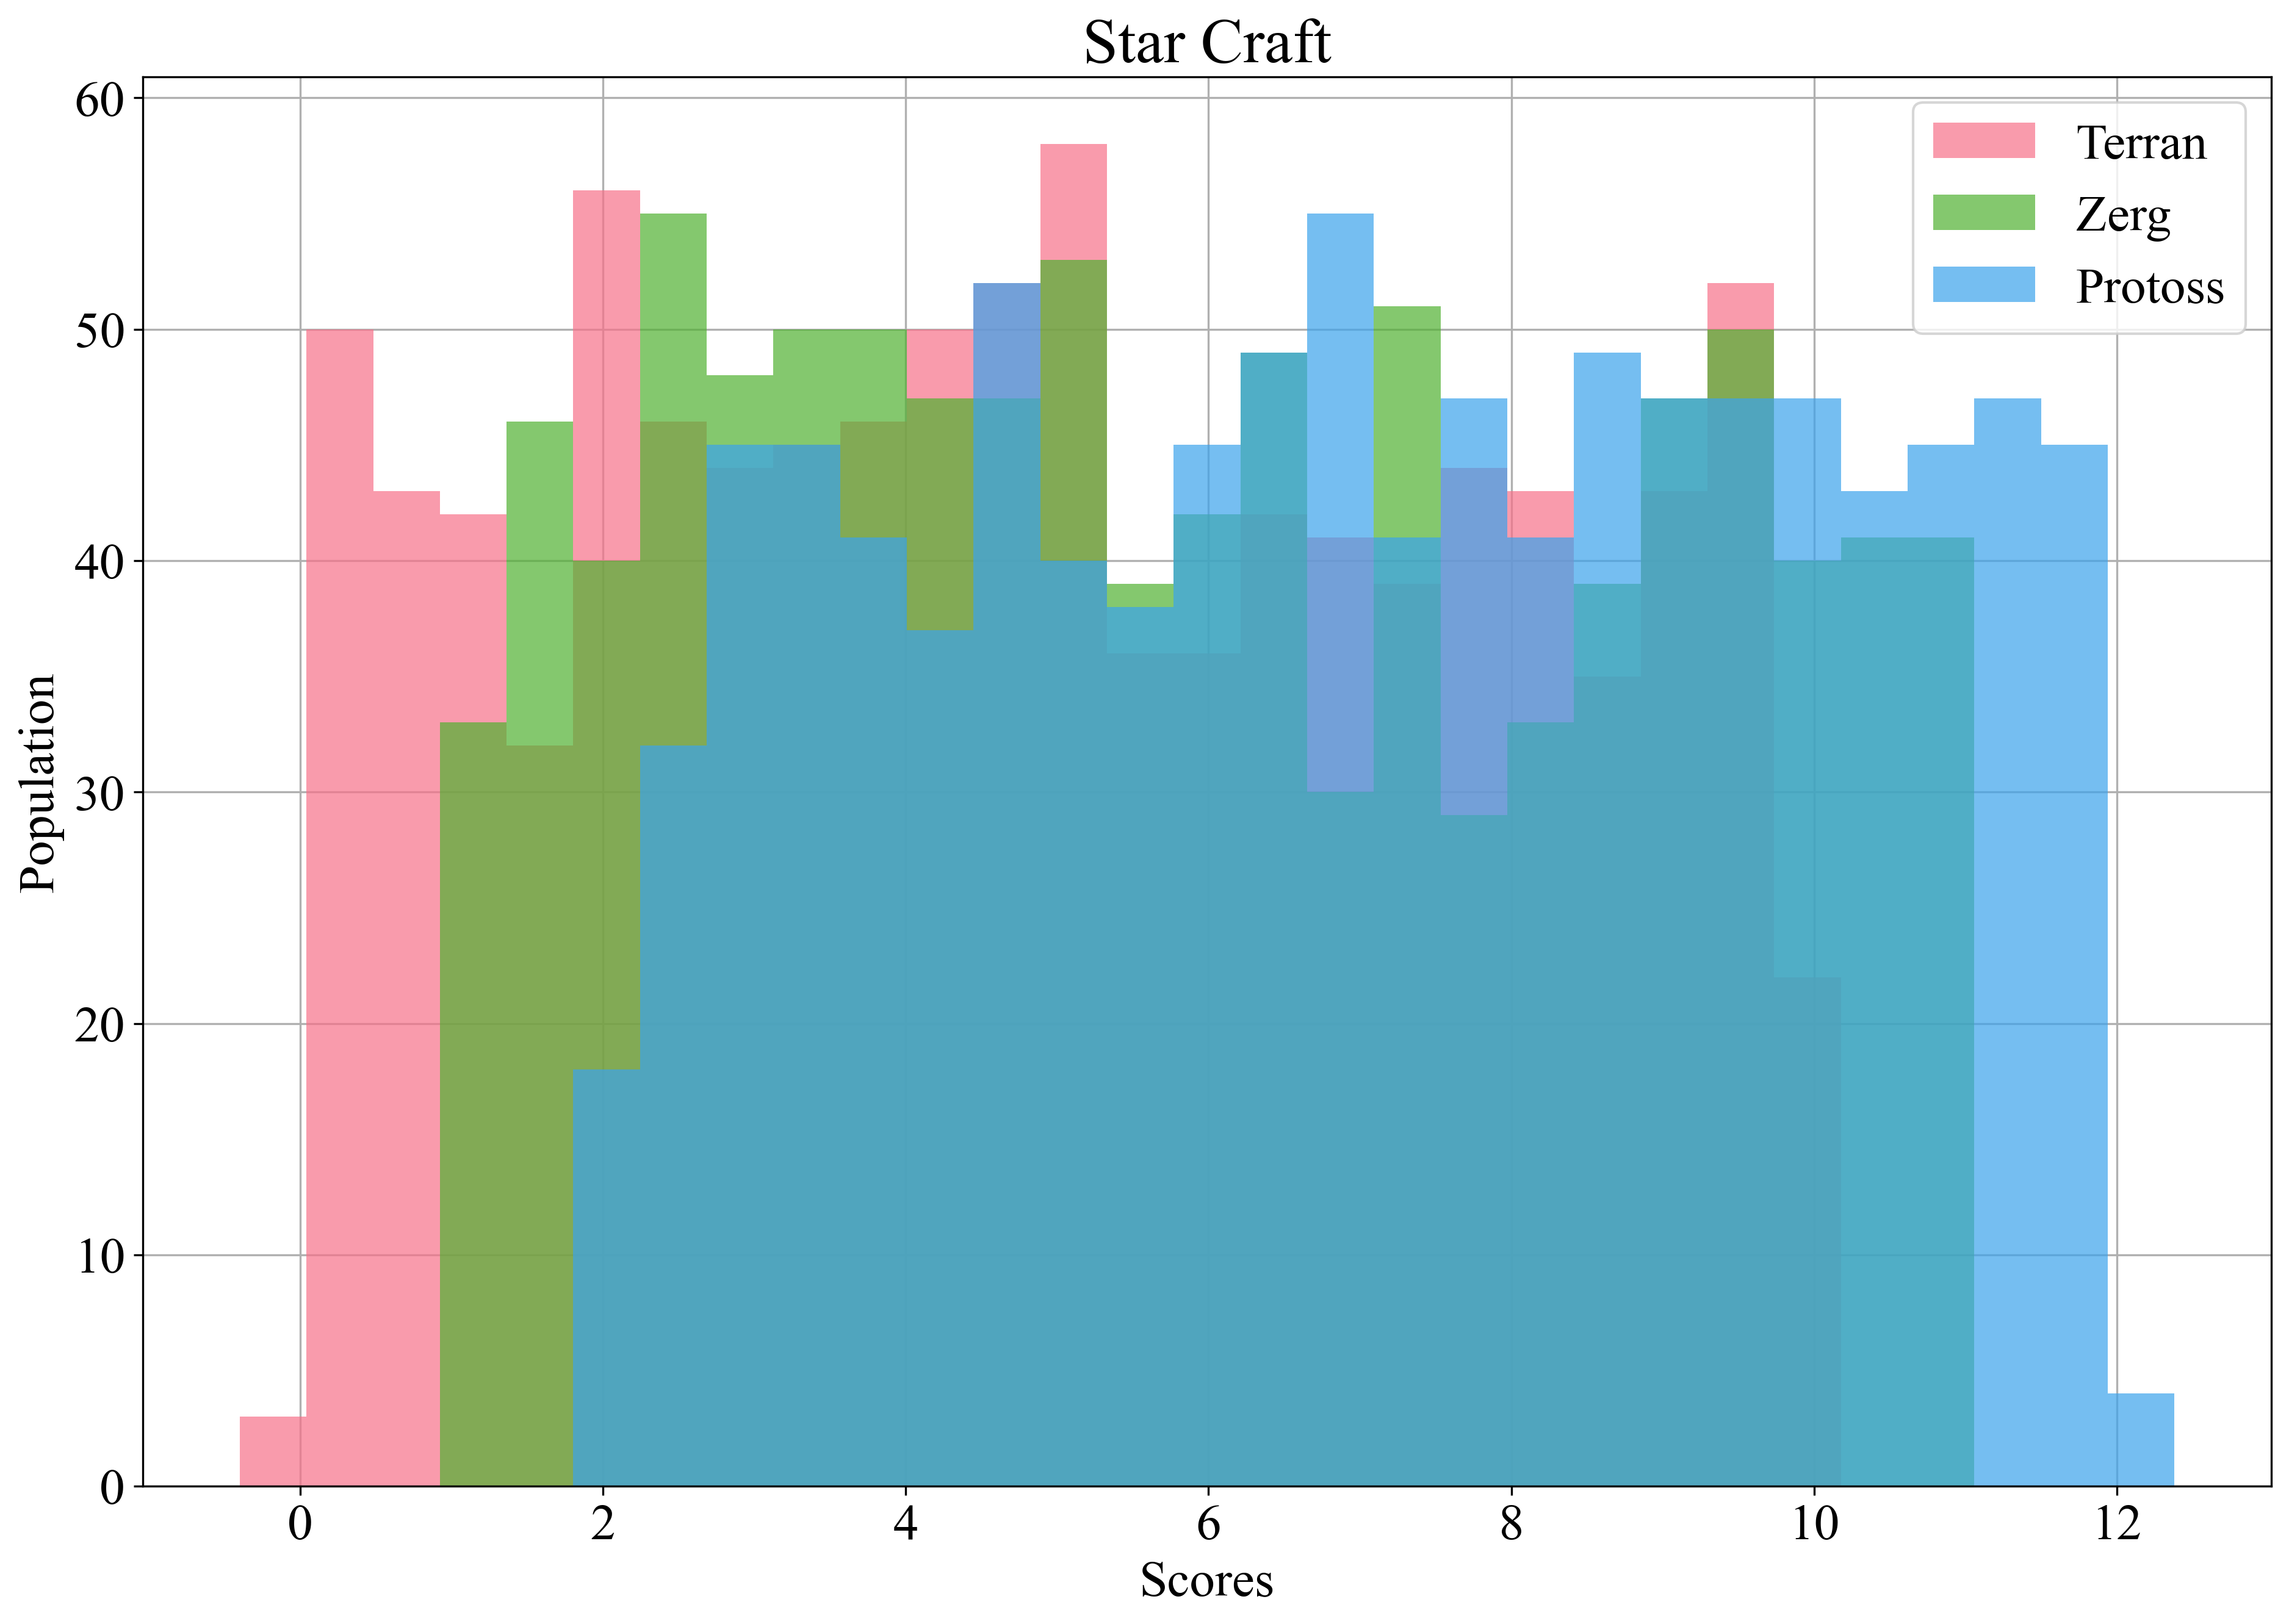
>>> data = {"Terran": list(np.random.rand(1000) * 10), "Zerg": list(np.random.rand(1000) * 10 + 1), "Protoss": list(np.random.rand(1000) * 10 + 2)}
>>> zz.plot.hist(data, xlab="Scores", ylab="Population", title="Star Craft")
- zerohertzLib.plot.pie(data, dim=None, title='tmp', colors=None, figsize=(15, 10), int_label=True, dpi=300)[source]
Dictionary로 입력받은 data를 pie chart로 시각화
- Parameters:
data¶ (
Dict[str, Union[int, float]]) – 입력 datadim¶ (
Optional[str]) – 입력data의 단위title¶ (
Optional[str]) – Graph에 표시될 제목 및 file 이름colors¶ (
Optional[Union[str, List]]) – 각 요소의 색figsize¶ (
Optional[Tuple[int]]) – Graph의 가로, 세로 길이int_label¶ (
Optional[bool]) – Label 내 수치의 소수점 표기 여부dpi¶ (
Optional[int]) – Graph 저장 시 DPI (Dots Per Inch)
- Returns:
저장된 graph의 절대 경로
- Return type:
str
Examples
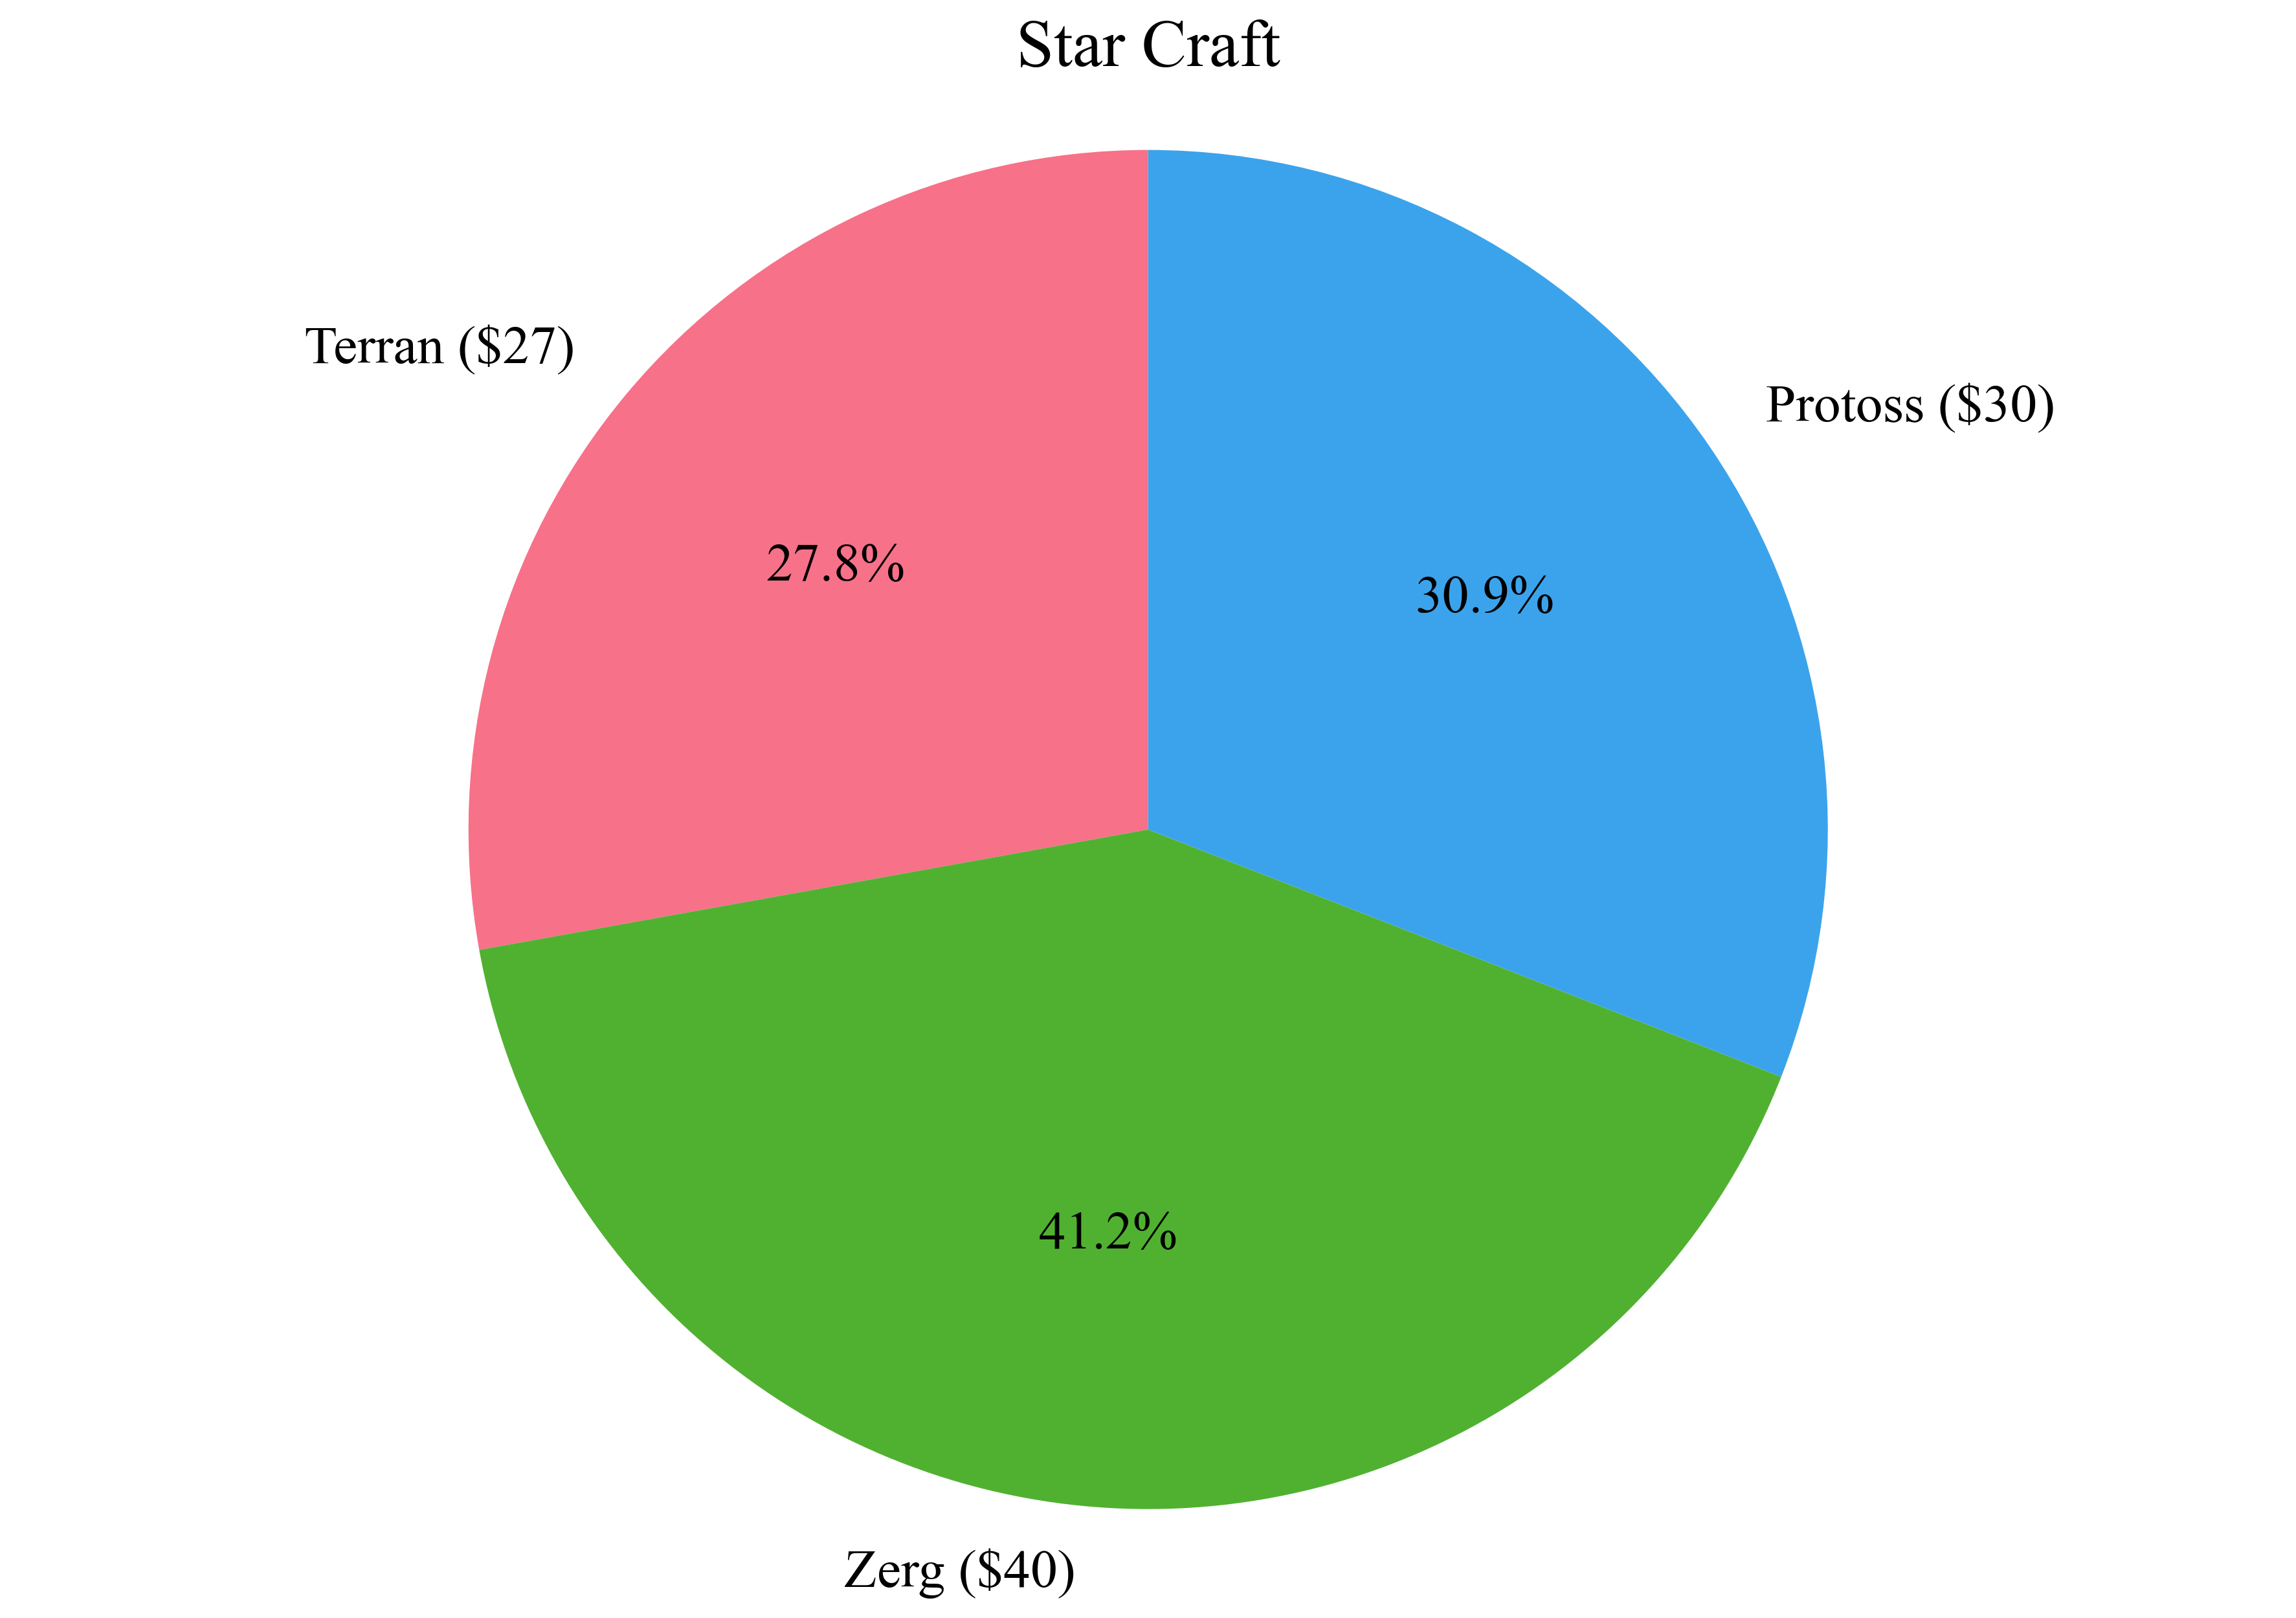
>>> data = {"Terran": 27, "Zerg": 40, "Protoss": 30}
>>> zz.plot.pie(data, dim="$", title="Star Craft")
- zerohertzLib.plot.plot(xdata, ydata, xlab=None, ylab=None, xlim=None, ylim=None, stacked=False, ncol=1, title='tmp', colors=None, markersize=12, figsize=(15, 10), dpi=300)[source]
List와 Dictionary로 입력받은 data를 line chart로 시각화
- Parameters:
xdata¶ (
Union[List[Union[int, float]], Dict[str, Union[int, float]]]) – 입력 data (X축)ydata¶ (
Union[List[Union[int, float]], Dict[str, Union[int, float]]]) – 입력 data (Y축)xlab¶ (
Optional[str]) – Graph에 출력될 X축 labelylab¶ (
Optional[str]) – Graph에 출력될 Y축 labelxlim¶ (
Optional[List[Union[int, float]]]) – Graph에 출력될 X축 limitylim¶ (
Optional[List[Union[int, float]]]) – Graph에 출력될 Y축 limitstacked¶ (
Optional[bool]) – Stacked plot 여부ncol¶ (
Optional[int]) – Graph에 표시될 legend 열의 수title¶ (
Optional[str]) – Graph에 표시될 제목 및 file 이름colors¶ (
Optional[Union[str, List]]) – 각 요소의 색markersize¶ (
Optional[int]) – Graph에 표시될 marker의 sizefigsize¶ (
Optional[Tuple[int]]) – Graph의 가로, 세로 길이dpi¶ (
Optional[int]) – Graph 저장 시 DPI (Dots Per Inch)
- Returns:
저장된 graph의 절대 경로
- Return type:
str
Examples
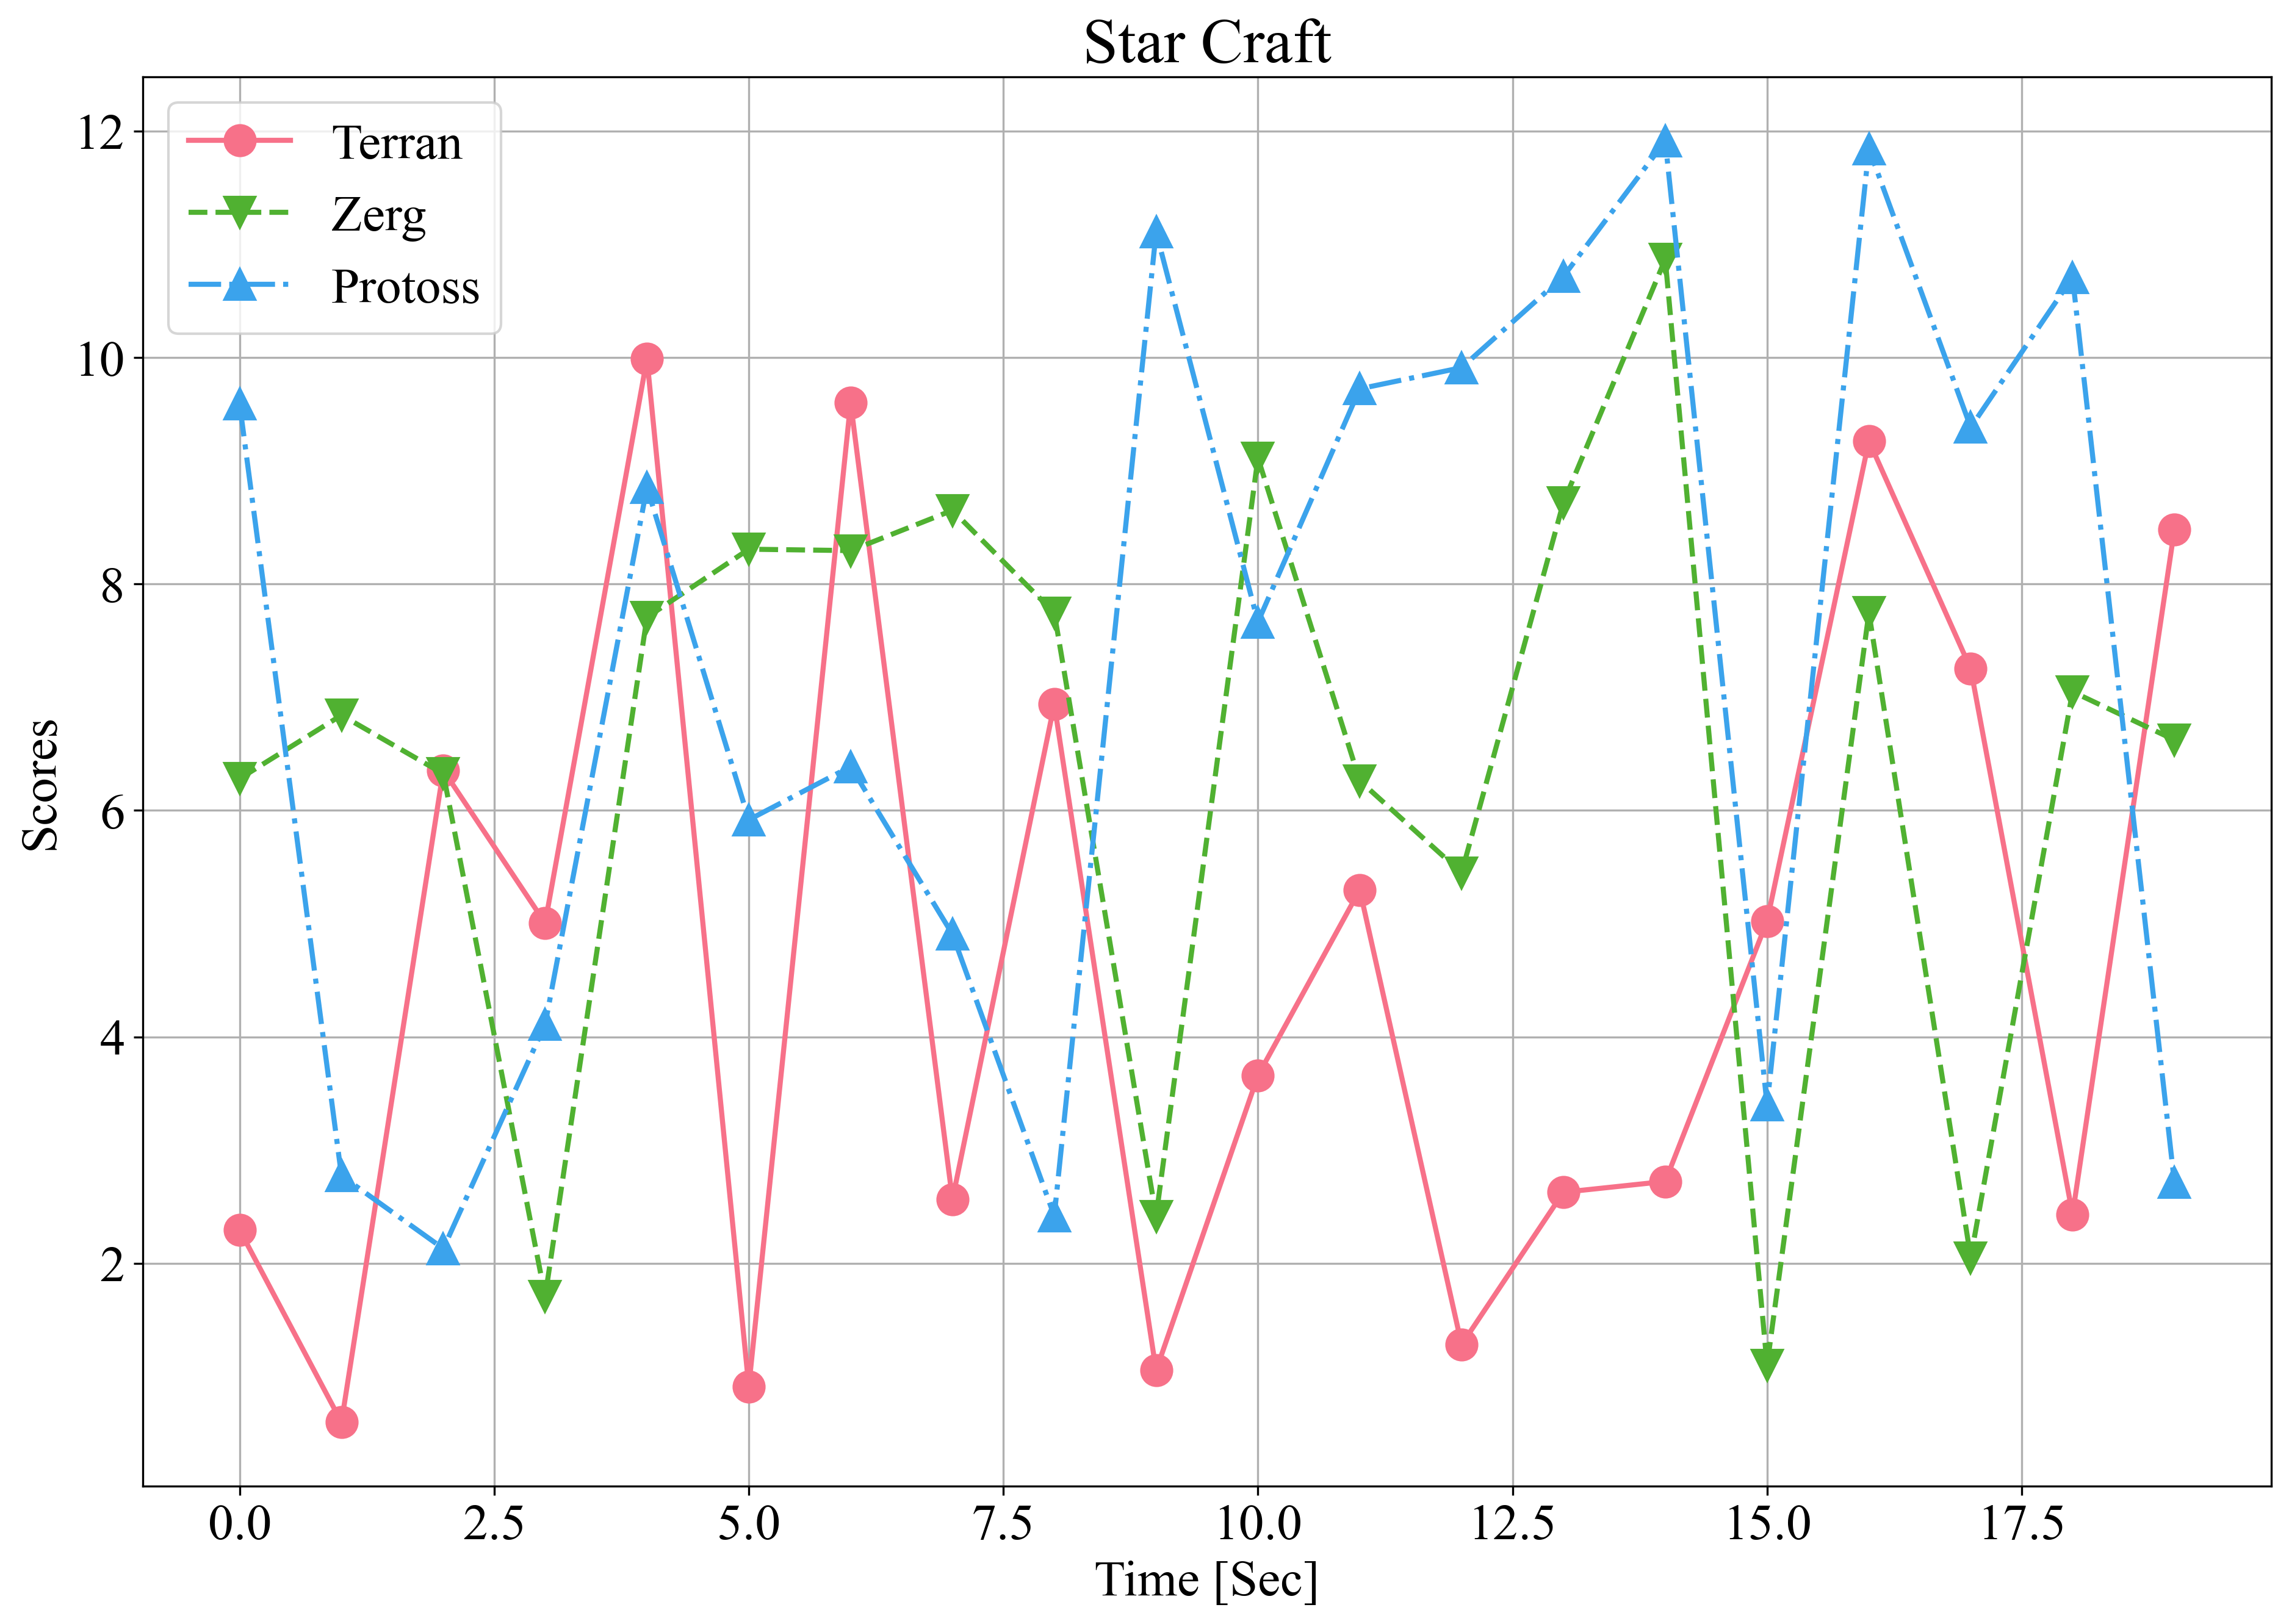
stacked=False:>>> xdata = [i for i in range(20)] >>> ydata = {"Terran": list(np.random.rand(20) * 10), "Zerg": list(np.random.rand(20) * 10 + 1), "Protoss": list(np.random.rand(20) * 10 + 2)} >>> zz.plot.plot(xdata, ydata, xlab="Time [Sec]", ylab="Scores", title="Star Craft")
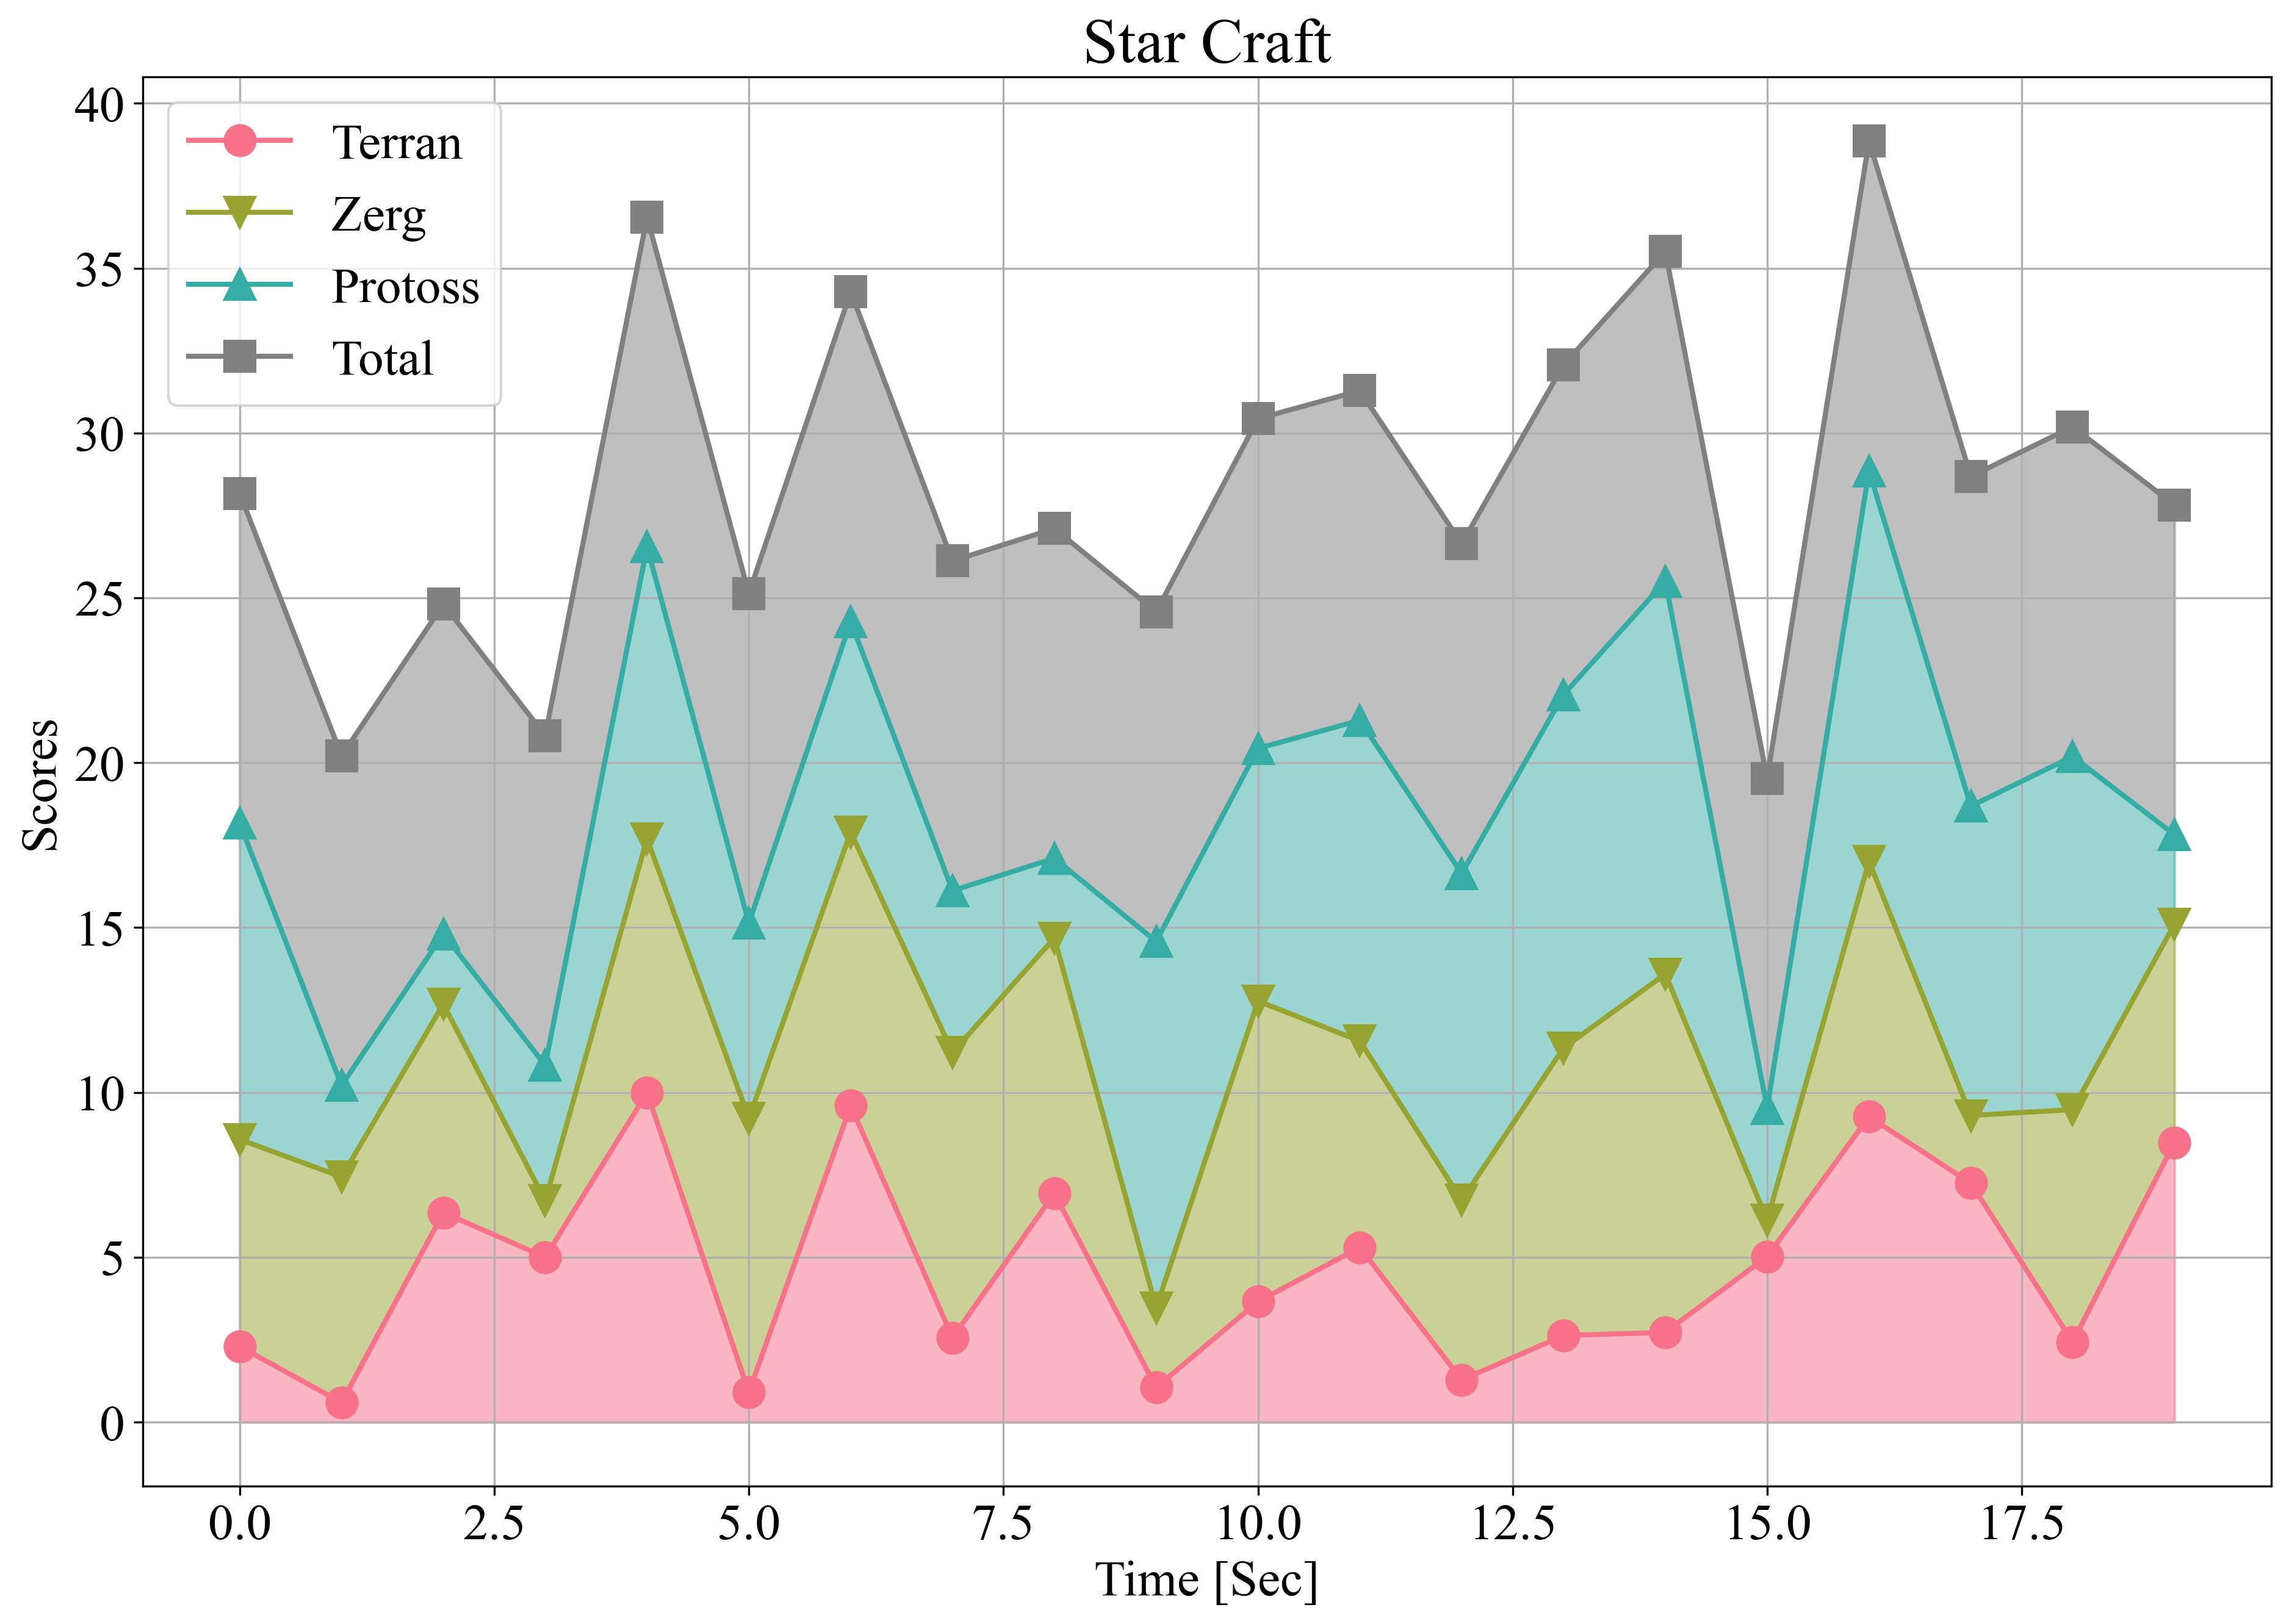
stacked=True:>>> ydata["Total"] = [sum(data) + 10 for data in zip(ydata["Terran"], ydata["Protoss"], ydata["Zerg"])] >>> zz.plot.plot(xdata, ydata, xlab="Time [Sec]", ylab="Scores", stacked=True, title="Star Craft")
- zerohertzLib.plot.savefig(title, dpi=300)[source]
Graph 저장 함수
- Parameters:
- Returns:
저장된 graph의 절대 경로
- Return type:
str
Examples
>>> zz.plot.savefig("Star Craft")
- zerohertzLib.plot.scatter(xdata, ydata, xlab=None, ylab=None, xlim=None, ylim=None, ncol=1, title='tmp', colors=None, markersize=36, figsize=(15, 10), dpi=300)[source]
Dictionary로 입력받은 data를 scatter plot으로 시각화
- Parameters:
xdata¶ (
Union[List[Union[int, float]], Dict[str, Union[int, float]]]) – 입력 data (X축)ydata¶ (
Union[List[Union[int, float]], Dict[str, Union[int, float]]]) – 입력 data (Y축)xlab¶ (
Optional[str]) – Graph에 출력될 X축 labelylab¶ (
Optional[str]) – Graph에 출력될 Y축 labelxlim¶ (
Optional[List[Union[int, float]]]) – Graph에 출력될 X축 limitylim¶ (
Optional[List[Union[int, float]]]) – Graph에 출력될 Y축 limitncol¶ (
Optional[int]) – Graph에 표시될 legend 열의 수title¶ (
Optional[str]) – Graph에 표시될 제목 및 file 이름colors¶ (
Optional[Union[str, List]]) – 각 요소의 색markersize¶ (
Optional[int]) – Graph에 출력될 marker의 크기figsize¶ (
Optional[Tuple[int]]) – Graph의 가로, 세로 길이dpi¶ (
Optional[int]) – Graph 저장 시 DPI (Dots Per Inch)
- Returns:
저장된 graph의 절대 경로
- Return type:
str
Examples
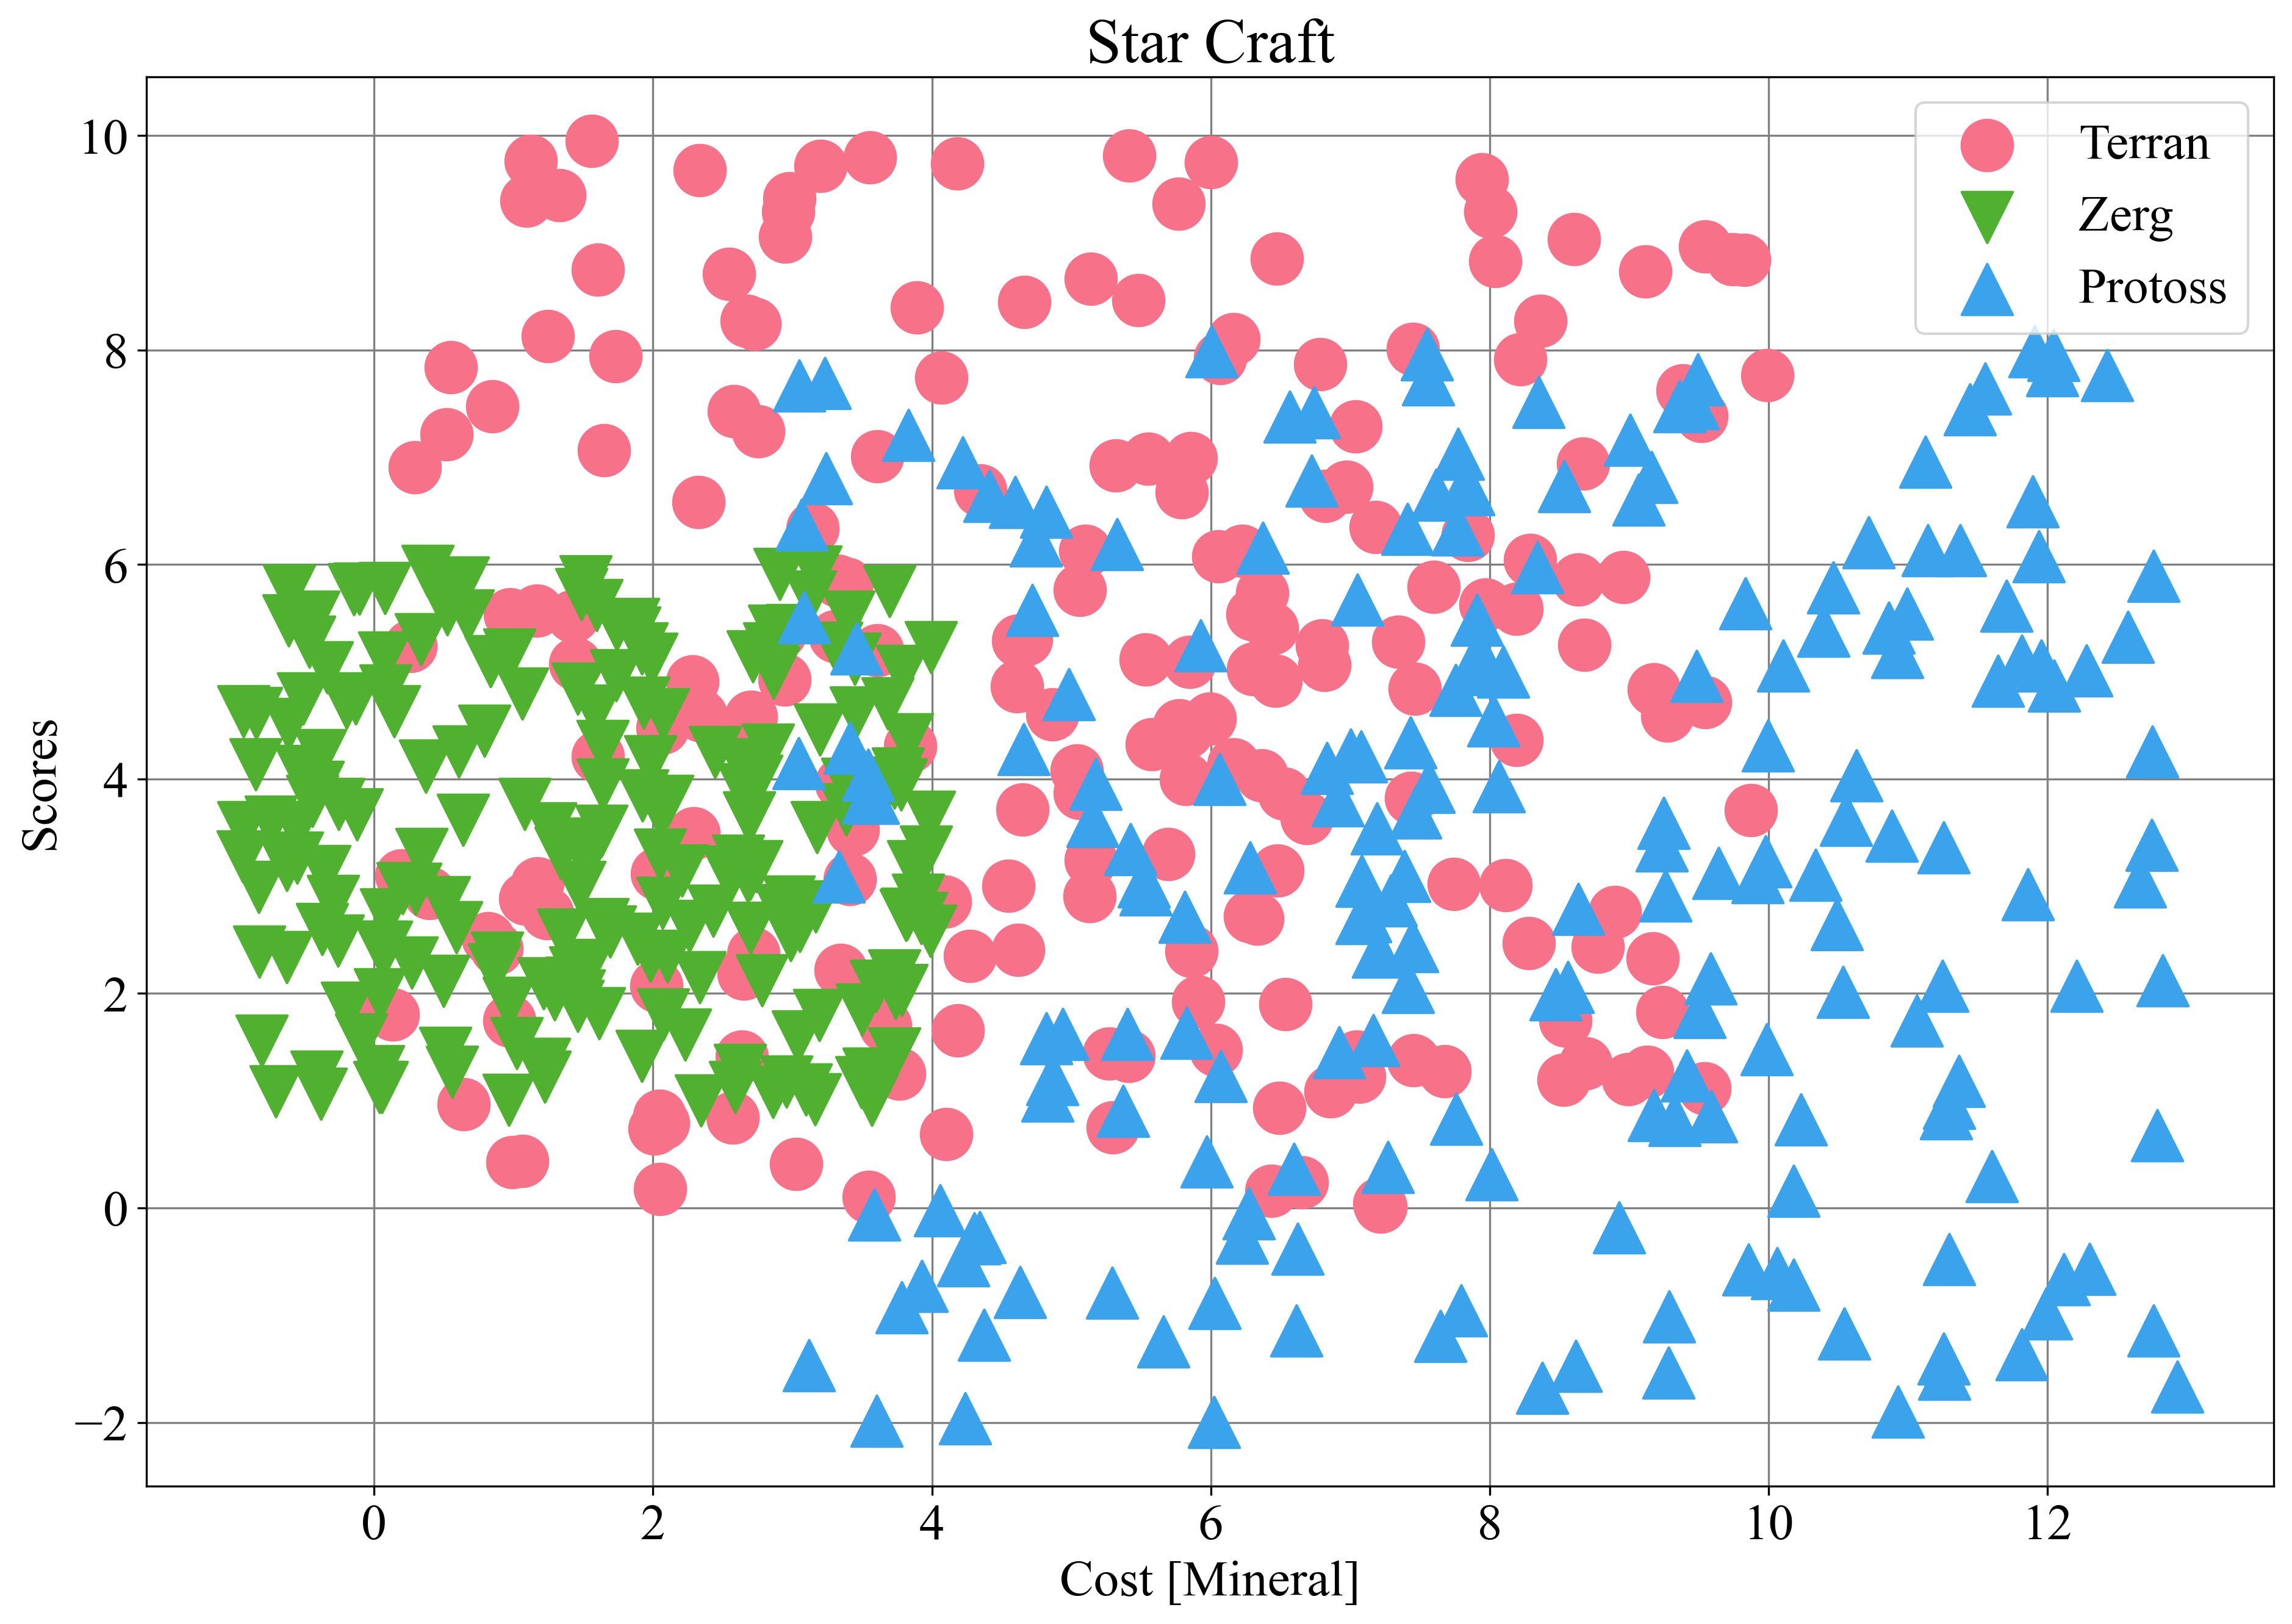
>>> xdata = {"Terran": [list(np.random.rand(200) * 10)], "Zerg": [list(np.random.rand(200) * 5 + 1)], "Protoss": [list(np.random.rand(200) * 10 - 2)]}
>>> ydata = {"Terran": [list(np.random.rand(200) * 10)], "Zerg": [list(np.random.rand(200) * 5 - 1)], "Protoss": [list(np.random.rand(200) * 10 + 3)]}
>>> zz.plot.scatter(xdata, ydata, xlab="Cost [Mineral]", ylab="Scores", title="Star Craft", markersize=400)
- zerohertzLib.plot.subplot(*args, **kwargs)[source]
Subplot 생성을 위한 함수
- Parameters:
- Returns:
Subplot axes 생성
- Return type:
matplotlib.axes.Axes
Examples
>>> zz.plot.subplot(nrows, ncols, index, **kwargs)
>>> zz.plot.subplot(2, 1, 1)
<Axes: >
- zerohertzLib.plot.table(data, col=None, row=None, title='tmp', fontsize=35, figsize=(20, 8), dpi=300)[source]
Dictionary로 입력받은 data를 scatter plot으로 시각화
- Parameters:
data¶ (
List[List[Union[int, float, str]]]) –len(row) X len(col)의 크기를 가지는 listcol¶ (
Optional[List[Union[int, float, str]]]]) – 열 (column)의 labelrow¶ (
Optional[List[Union[int, float, str]]]]) – 행 (row)의 labeltitle¶ (
Optional[str]) – 저장될 file의 이름fontsize¶ (
Optional[int]) – 문자의 크기figsize¶ (
Optional[Tuple[int]]) – Graph의 가로, 세로 길이dpi¶ (
Optional[int]) – Graph 저장 시 DPI (Dots Per Inch)
- Returns:
저장된 graph의 절대 경로
- Return type:
str
Examples
>>> data = [["123", 123, 123.4], [123.4, "123", 123], [123, 123.4, "123"], ["123", 123, 123.4]]
>>> col = ["Terran", "Zerg", "Protoss"]
>>> row = ["test1", "test2", "test3", "test4"]
>>> zz.plot.table(data, col, row, title="Star Craft")
>>> zz.plot.table(data, col, row, title="Star Craft2", fontsize=50)
