zerohertzLib.monitoring

Monitoring

현재 기기의 상태를 살펴볼 수 있는 함수들

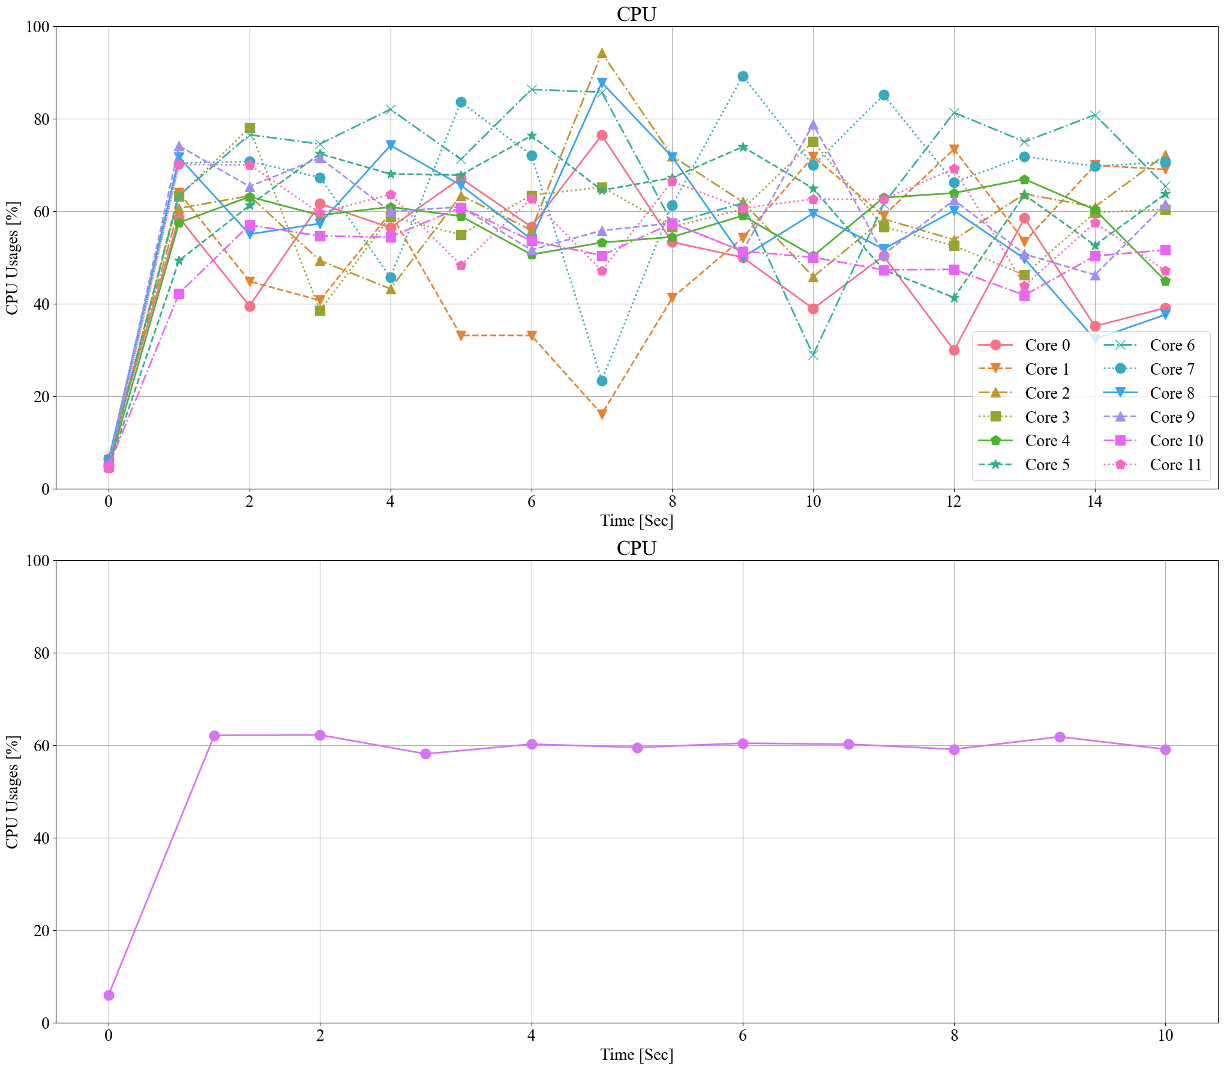
zerohertzLib.monitoring.cpu(tick=1, threshold=10, path='CPU', dpi=100, per=True)[source]

시간에 따른 CPU의 사용량을 각 코어에 따라 line chart로 시각화

Parameters:
  • tick (Optional[int]) – Update 주기

  • threshold (Optional[int]) – 시각화할 총 시간

  • path (Optional[str]) – Graph를 저장할 경로

  • dpi (Optional[int]) – Graph 저장 시 DPI (Dots Per Inch)

  • per (Optional[bool]) – CPU 개별 사용량 시각화 여부

Returns:

지정한 경로에 바로 graph 저장

Return type:

None

Examples

>>> zz.monitoring.cpu(threshold=15)
>>> zz.monitoring.cpu(per=False)
_images/monitoring.cpu.png
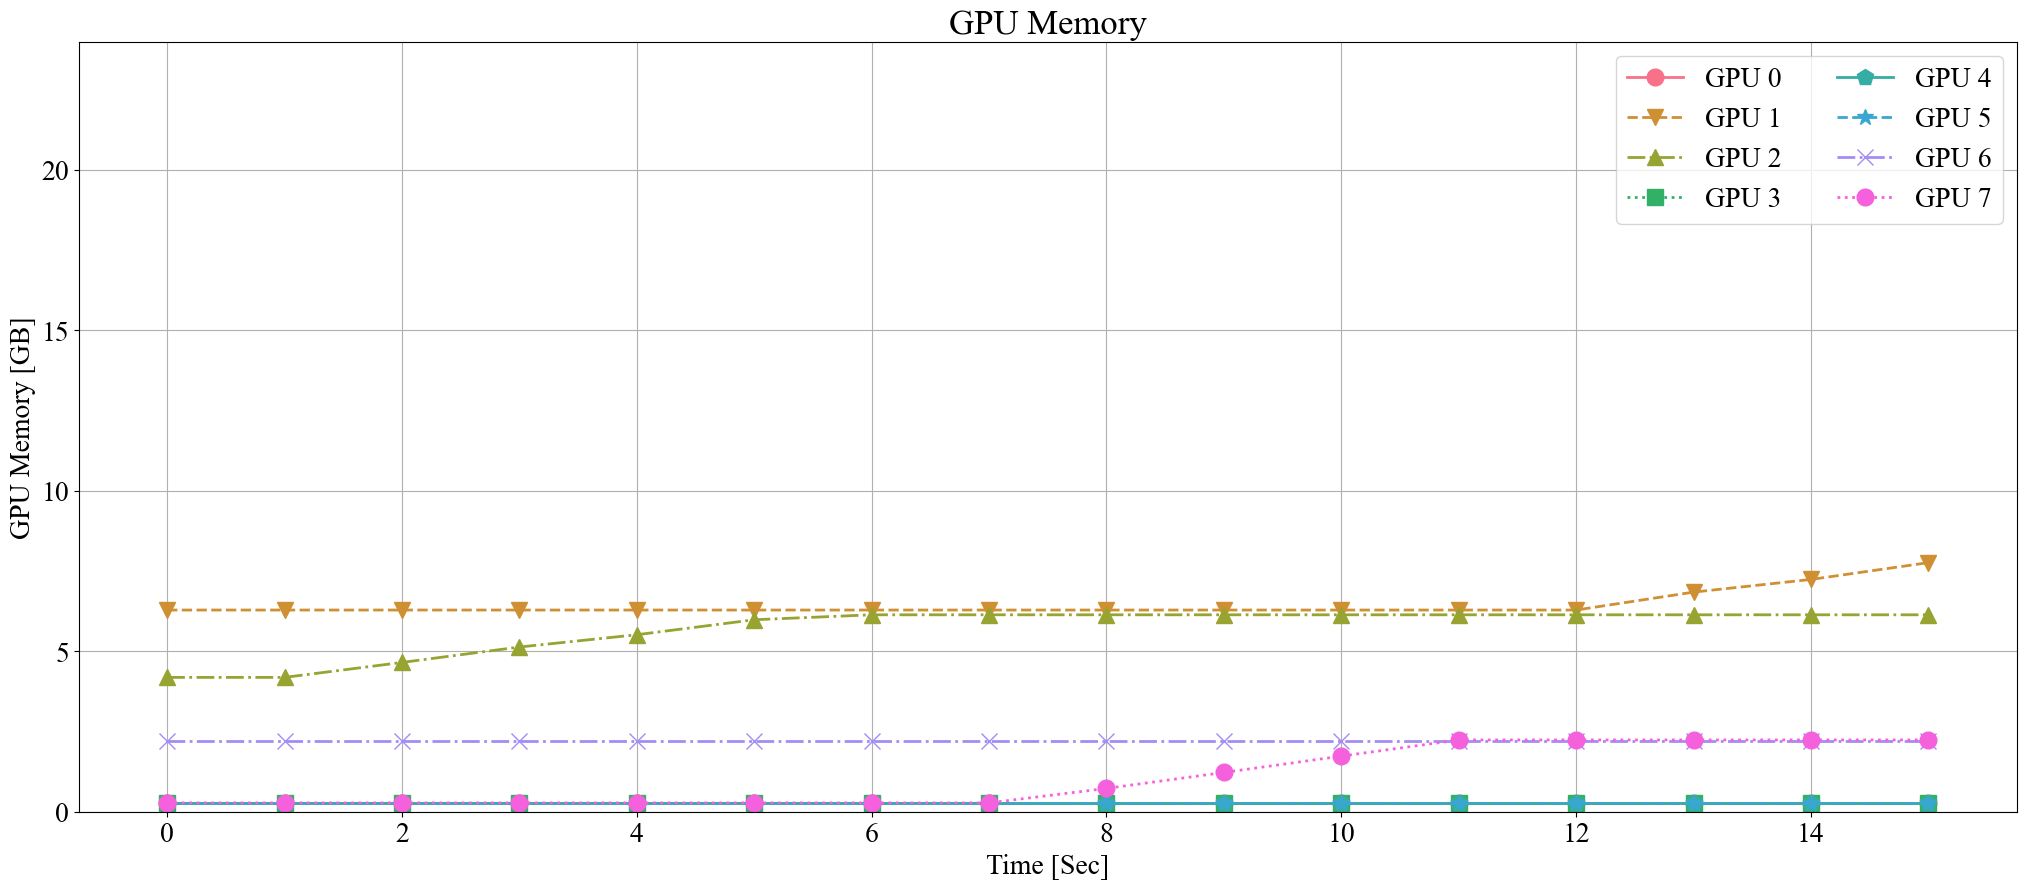
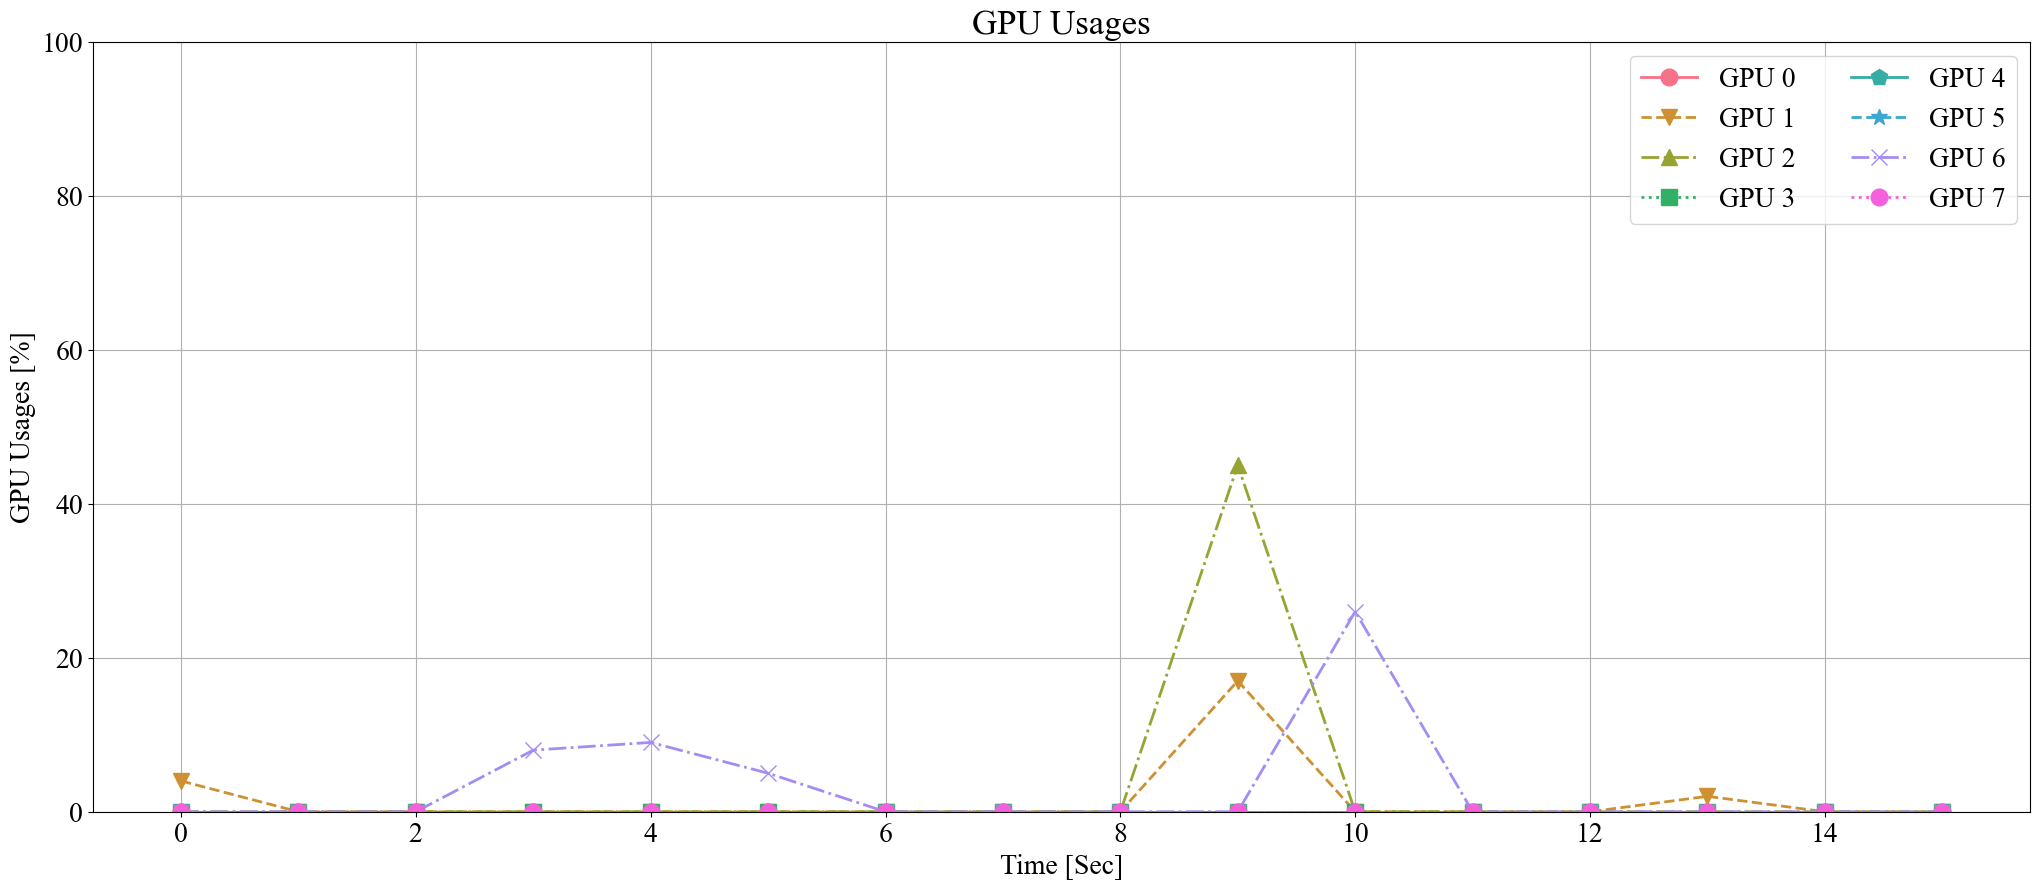
zerohertzLib.monitoring.gpu_memory(tick=1, threshold=10, grep=None, path='GPU Memory', dpi=100)[source]

시간에 따른 GPU의 memory 사용량을 각 GPU에 따라 line chart로 시각화

Parameters:
  • tick (Optional[int]) – Update 주기

  • threshold (Optional[int]) – 시각화할 총 시간

  • grep (Optional[List[int]]) – 시각화할 GPU의 번호

  • path (Optional[str]) – Graph를 저장할 경로

  • dpi (Optional[int]) – Graph 저장 시 DPI (Dots Per Inch)

Returns:

지정한 경로에 바로 graph 저장

Return type:

None

Examples

>>> zz.monitoring.gpu_memory(threshold=15)
_images/monitoring.gpu_memory.png
zerohertzLib.monitoring.gpu_usages(tick=1, threshold=10, grep=None, path='GPU Usages', dpi=100)[source]

시간에 따른 GPU의 사용량을 각 GPU에 따라 line chart로 시각화

Parameters:
  • tick (Optional[int]) – Update 주기

  • threshold (Optional[int]) – 시각화할 총 시간

  • grep (Optional[List[int]]) – 시각화할 GPU의 번호

  • path (Optional[str]) – Graph를 저장할 경로

  • dpi (Optional[int]) – Graph 저장 시 DPI (Dots Per Inch)

Returns:

지정한 경로에 바로 graph 저장

Return type:

None

Examples

>>> zz.monitoring.gpu_usages(threshold=15)
_images/monitoring.gpu_usages.png
zerohertzLib.monitoring.storage(path='.', threshold=1)[source]

지정한 경로에 존재하는 file에 따른 용량을 pie graph로 시각화

Parameters:
  • path (Optional[str]) – 용량을 시각화할 경로

  • threshold (Optional[int]) – Etc.로 분류될 임계값 (단위: %)

Returns:

저장된 graph의 절대 경로

Return type:

str

Examples

>>> zz.monitoring.storage(".")
_images/monitoring.storage.png