Data 기반 의사결정의 시대에 진입하며, machine learning model은 다양한 비즈니스 application의 중심 요소로 부상하고 있다. 그렇지만 다른 기술과 마찬가지로, model의 효과와 신뢰도는 주로 어떤 data로 훈련받았는가에 큰 영향을 받는다. 이에 따라 data shift 문제를 필연적으로 고려해야한다. Data shift는 특정 model이 훈련을 받은 data의 분포와 실제 세계에서 접하는 data의 분포 사이에 차이가 생길 때 나타난다. 이로 인해 모델의 성능이 크게 저하되거나 예측이 왜곡될 수 있다. 실제 세계의 데이터는 계절 변화, 시장 동향과 같은 다양한 요인들로 지속적으로 변화하므로, 단순히 모델을 생성하는 것만으로는 그 변화에 대응하기 어렵다. 이 때문에 model이 지속적으로 데이터의 변화에 적응하면서 관련성을 유지할 수 있도록 지원하는 mechanism이 필요하다는 인식이 생겼고, continuous learning이 주목받게 되었다. Continuous learning은 최근의 데이터 변화를 포착하고 적응하면서 model을 주기적으로 갱신하는 체계다. 그러나 이런 체계를 구축하는 것은 복잡하며 여러 요소를 고려해야 한다. 따라서 이번 글에서는, data shift가 시간에 따라 발생하는 예제 데이터를 생성해 볼 것이며, 그 data를 기반으로 Apache Airflow를 이용해 아래와 같이 continuous training하는 DAG를 만들어 continuous learning에 대한 이해를 조금이나 얻어보려고한다.
Data Shift
먼저 시간에 따른 데이터를 입력할 DB (PostgreSQL)를 생성하기 위해 아래 manifest를 실행한다. Service와 Deployment는 kubectl apply -f postgresql.yaml을 통해 실행할 수 있다.
머리 속에 깊이 잠자고 있는 고등학교 때 배웠던 수학들을 꺼내어 아래 코드를 구현했다. 주어진 class의 수와 시간에 따라 변화하고 원점과의 거리가 ENV.RADIUS이며 분산이 1인 정규분포 데이터를 만들었다. 시간이 지남에 따라서 평균 (mean_x, mean_y)이 원을 그리도록 개발했다. 이렇게 생성된 data는 PostgresOperator로 query를 보내 data를 적재할 수 있게 했다.
import airflow import numpy as np from airflow.decorators import dag from airflow.operators.python_operator import PythonOperator from airflow.providers.postgres.operators.postgres import PostgresOperator from dateutil.parser import parse from lib import Environment
def_generate_queries(class_name, num_entries, ts): queries = [] mean_x, mean_y = _mean(int(ts[11:13]), class_name) ts = parse(ts) for _ inrange(num_entries): x = np.random.normal(mean_x, 1) y = np.random.normal(mean_y, 1) queries.append( f"INSERT INTO CONTINUOUS_TRAINING (time, x, y, class) VALUES ('{ts.strftime('%Y-%m-%d %H:%M:%S%z')}', {x}, {y}, '{class_name}');" ) return"\n".join(queries)
def_merge_queries(ti): queries = [] for c in ENV.CLASSES: queries.append(ti.xcom_pull(task_ids=f"generate_data_{c}")) return"\n".join(queries)
@dag( dag_id="Create-Data", start_date=airflow.utils.dates.days_ago(2), end_date=airflow.utils.dates.days_ago(1), schedule_interval="@hourly", max_active_runs=12, catchup=True, tags=["MLOps", "Data Engineering"], ) defcreate_data(): create_table = PostgresOperator( task_id="create_table", postgres_conn_id=ENV.DB, sql=""" CREATE TABLE IF NOT EXISTS CONTINUOUS_TRAINING ( time TIMESTAMP NOT NULL, x FLOAT NOT NULL, y FLOAT NOT NULL, class TEXT NOT NULL ); """, )
generate_queries = []
for c in ENV.CLASSES: generate_query = PythonOperator( task_id=f"generate_data_{c}", python_callable=_generate_queries, op_args=[c, ENV.NO_DATA], do_xcom_push=True, ) generate_queries.append(generate_query)
DB=# SELECT time, class, AVG(x) AS avg_x, AVG(y) AS avg_y FROM continuous_training WHERE class IN ('A', 'B', 'C') GROUPBY time, class ORDERBY time, class; time| class | avg_x | avg_y ---------------------+-------+-----------------------+----------------------- 2023-08-2600:00:00| A |2.4045409487416998|0.040922815013869365 2023-08-2600:00:00| B |-1.1737959659258457|2.1460601636034657 2023-08-2600:00:00| C |-1.2033114946199557|-2.0674824541958245 2023-08-2601:00:00| A |2.2658467036147827|0.5747269069953029 2023-08-2601:00:00| B |-1.8425758017968537|1.8098944512019666 2023-08-2601:00:00| C |-0.6915502372929186|-2.407668482725042 2023-08-2602:00:00| A |2.150430855425532|1.191560603528595 2023-08-2602:00:00| B |-2.082350490108075|1.1374431005941859 2023-08-2602:00:00| C |-0.011051726332470002|-2.4709247754120476 2023-08-2603:00:00| A |1.6417773209790472|1.720475275302636 2023-08-2603:00:00| B |-2.302885070406296|0.6431434361363254 2023-08-2603:00:00| C |0.7193753880170582|-2.3782277040762754 2023-08-2604:00:00| A |1.087256799646457|2.2591619532786407 2023-08-2604:00:00| B |-2.3960202086984657|0.019288817697385604 2023-08-2604:00:00| C |1.2260408746440097|-2.093929943264823 ...
Continuous Training
학습을 하고 시각화하기 위해서는 scikit-learn,matplotlib과 같은 다양한 library가 필요하니 KubernetesPodOperator를 사용한다. 또한 위에서 적재한 data들을 시간에 따라 불러오기 위해 PostgresOperator를 사용하려 했으나, data의 수가 증가함에 따라 아래와 같은 활용이 불가능함을 확인했다.
따라서 KubernetesPodOperator의 Docker image에서 DB의 data를 추출하고 학습할 수 있게 아래 DAG를 개발했다. generate_queries task에서 logical time의 2시간 전 부터 logical time까지의 data를 가져오는 query를 KubernetesPodOperator의 환경 변수로 입력받을 수 있게 작성한다.
import airflow from airflow.decorators import dag from airflow.operators.python_operator import PythonOperator from airflow.providers.cncf.kubernetes.operators.kubernetes_pod import ( KubernetesPodOperator, ) from dateutil.parser import parse from lib import Environment, _send_discord_message
ENV = Environment("CT")
def_generate_queries(ts): ts = parse(ts) returnf""" SELECT * FROM continuous_training WHERE time >= TIMESTAMP '{ts.strftime('%Y-%m-%d %H:%M:%S%z')}' - INTERVAL '2 hours' AND time <= TIMESTAMP '{ts.strftime('%Y-%m-%d %H:%M:%S%z')}'; """
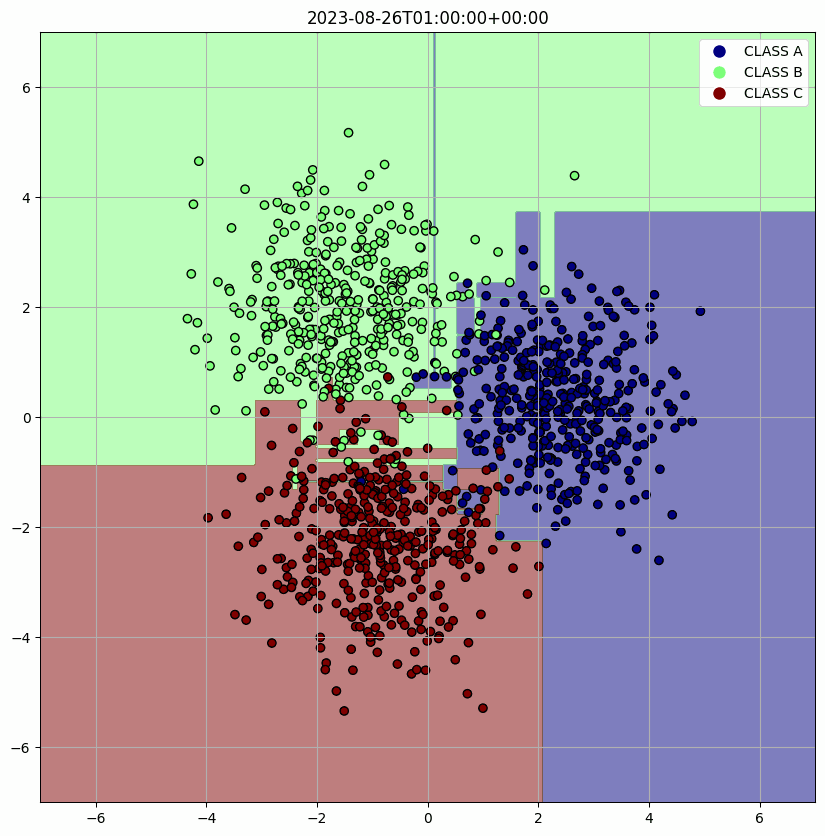
위에서 정의한 Docker image 내의 환경 변수들을 가져오고 그 값들을 통해 DB에 연결하고 query로 DB에서 원하는 data를 추출한다. 그리고 학습한 결과를 시각화하고 Discord webhook으로 사용자에게 전달한다. 생성한 data에 대해 가장 직관적으로 시각화할 수 있는 Decision Tree를 사용할 model로 채택했다.
import matplotlib.pyplot as plt import numpy as np import psycopg2 import requests from sklearn.tree import DecisionTreeClassifier
WEBHOOK = os.environ.get("WEBHOOK") CLASSES = eval(os.environ.get("CLASSES")) TIME = os.environ.get("TIME") QUERY = os.environ.get("QUERY") user = os.environ.get("user") password = os.environ.get("password") host = os.environ.get("host") port = os.environ.get("port") database = os.environ.get("database")
defexecute_query(query): with psycopg2.connect( user=user, password=password, host=host, port=port, database=database ) as connection: with connection.cursor() as cursor: cursor.execute(query) records = cursor.fetchall() return records
defmain(): data = execute_query(QUERY) X = np.array([[item[1], item[2]] for item in data]) y = np.array([CLASSES.index(item[3]) for item in data])
clf = DecisionTreeClassifier() clf.fit(X, y)
plt.figure(figsize=(10, 10)) ax = plt.gca()
xlim = (-7, 7) ylim = (-7, 7)
xx = np.linspace(xlim[0], xlim[1], 500) yy = np.linspace(ylim[0], ylim[1], 500)
YY, XX = np.meshgrid(yy, xx) xy = np.vstack([XX.ravel(), YY.ravel()]).T Z = clf.predict(xy)